Wall Street Memes (WSM) Price Is Firm, Exhibiting a Spiral
Estimated Reading Time: 3 minutes
Don’t invest unless you’re prepared to lose all the money you invest. This is a high-risk investment and you are unlikely to be protected if something goes wrong. Take 2 minutes to learn more

Wall Street Memes Price Prediction – April 24
It appears that the forces and trends prevailing in the pricing dynamics between buyers and sellers are being reshaped below the negative side of the upper Bollinger Band indicator, as the WSM/USD price holds firm at a threshold, often exhibiting a spiral pattern.
Amid prevailing market dynamics, investors with extended holding strategies are advised to tread carefully when initiating short positions, particularly if price movements suggest only shallow pullbacks ahead of a possible surge into exceptional upward trends, fueled by revitalized buying interest and broad-based optimism.
WSM/USD Market
Key Levels
Resistance levels: $0.0015, $0.002, $0.0025
Support levels: $0.0008, $0.0006, $0.0004
WSM/USD – 4-hour Chart
The WSM/USD medium-term chart pictures that the crypto-economic price holds firm at a threshold, often exhibiting a spiral pattern.
The stochastic oscillators have entered deep into the overbought territory, suggesting an impending upward breakout may be on the horizon. Minor bearish retracements have emerged at various lower candlestick wicks, reinforcing the likelihood of strategic entry points for initiating new long positions near the dynamic support levels of the Bollinger Bands, with momentum steadily building.
With WSM/USD featuring lower lows at the lower Bollinger Band, could a bullish reversal be imminent soon?
Putting the rising phase into consideration, many forces are yet to be exerted, as the WSM/USD price holds firm at a threshold, often exhibiting a spiral pattern.
Recovery efforts are expected to persist, even if occasional downward momentum surfaces along the way. Long-term investors are encouraged to focus on gradually strengthening their portfolios by strategically accumulating positions during dip phases, which are likely to serve as foundational setups for significant future rebounds.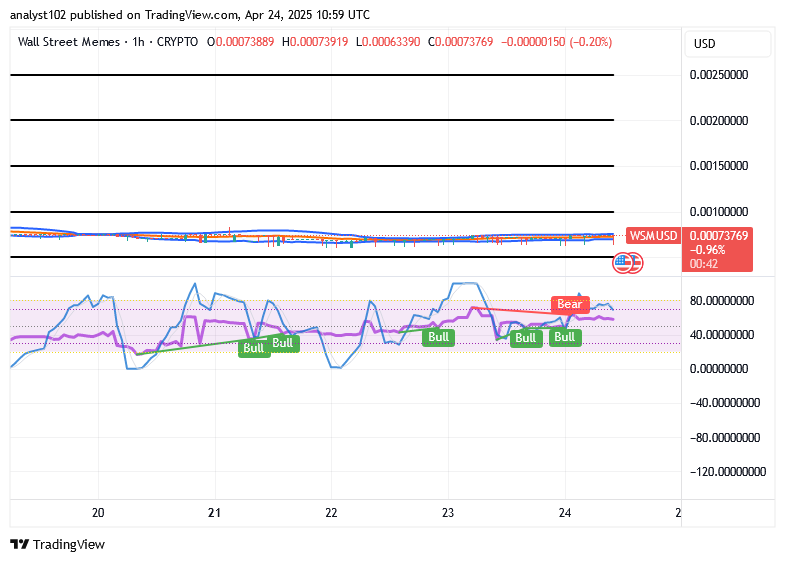
WSM/USD 1-hour chart
The WSM/USD 1-hour chart depicts that the short-term movements of the base crypto-economic market hold firm at a threshold, often exhibiting a spiral pattern.
The Bollinger Bands are observed steadily narrowing in a lateral orientation, indicating that consolidation remains dominant within the market’s ongoing activity. The stochastic oscillators are presently reflecting a mild bearish signal, issuing a technical caution against anticipating a sudden breakout before the market fully establishes directional clarity through measured accumulation.
$WSM / $USDT is now officially tradeable on #Bybit Perpetuals, offering enhanced flexibility, leveraged exposure, and increased opportunities for dynamic crypto market strategies.
$WSM community, we saw your Tweets! 👏$WSM / $USDT is now tradeable on #Bybit Perpetuals.
— Bybit (@Bybit_Official) October 13, 2023
Trade here: https://t.co/le4XyVyXaZ
Also want your project listed? Share your suggestions here:https://t.co/W7EWJVVNV5 https://t.co/XgXoL7g0rF