Ethereum (ETH/USD) Price Trades Between $2,250 and $2,000
Estimated Reading Time: 3 minutes
Don’t invest unless you’re prepared to lose all the money you invest. This is a high-risk investment and you are unlikely to be protected if something goes wrong. Take 2 minutes to learn more

Free Crypto Signals Channel
Ethereum Price Prediction – May 16
The recent ugly deep downs in the ETH/USD market activities have led to the settling of fresh lower trading zones. Presently, the crypto-economic price trades between $2,250 and $2,000 value points on the major technical viewing angle.
ETH/USD Market
Key Levels:
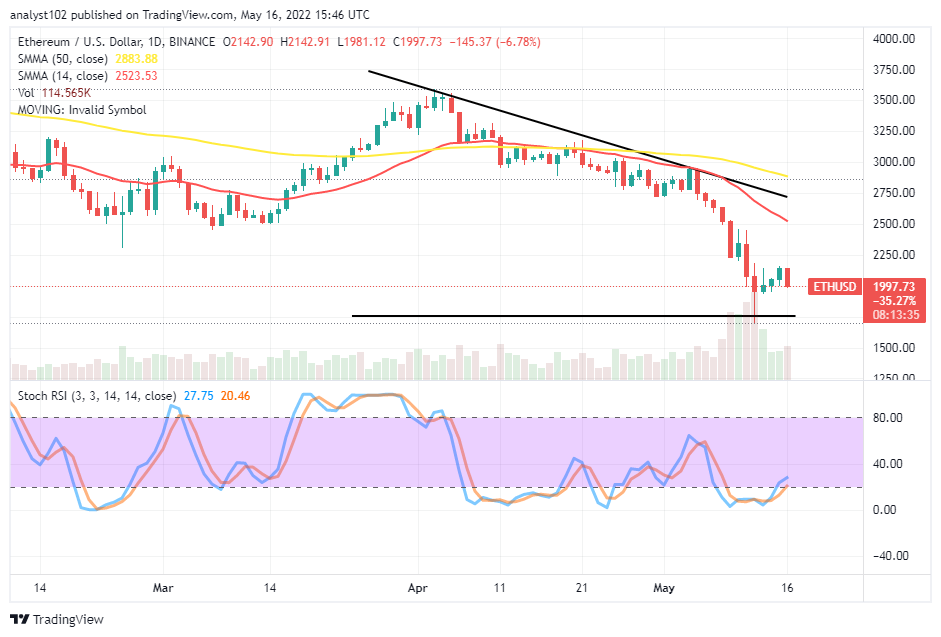
Resistance levels: $2,250, $2,500, $2,750
Support levels: $2,000, $1,750, $1,500
ETH/USD – Daily Chart
The ETH/USD daily chart reveals the crypto-economic market price trades between $2,250 and $2,000 value lines about a couple of days back. On May 10, the price had a pit stop to continue downing on the succeeding trading day’s session. The horizontal line drawn at the $2,000 support level is serving as an expectant baseline to getting decent upward swinging against the current downward trending motions. The 14-day SMA is underneath the 50-day SMA. And they are far above the current trading spot. The Stochastic Oscillators have slightly moved northbound from the oversold to try attempting to cross back southbound around it.
Will the ETH/USD price trade between $2,250 and $2,000 for some time?
It’s not safe to keep the expectation of thinking that the ETH/USD price will trade between $2,250 and $2,000 trading value lines for some time in the face of the current volatility. That said, it required long-position takers to be on the lookout for any probable chance of pushing back the market from an active downing force toward the $2,000 before considering joining.
On the downside of the technical analysis, the ETH/USD market short-position takers now have the leverage of domineering power to get back into the crypto business operation below the sell signal side of the 14-day SMA covering the $2,250 and $2,500 resistance points. The moment the price tends to hike its worth aggressively or in a sequential moving manner through those value lines will mark an end of the continuation of the present downward trending cycle for a while.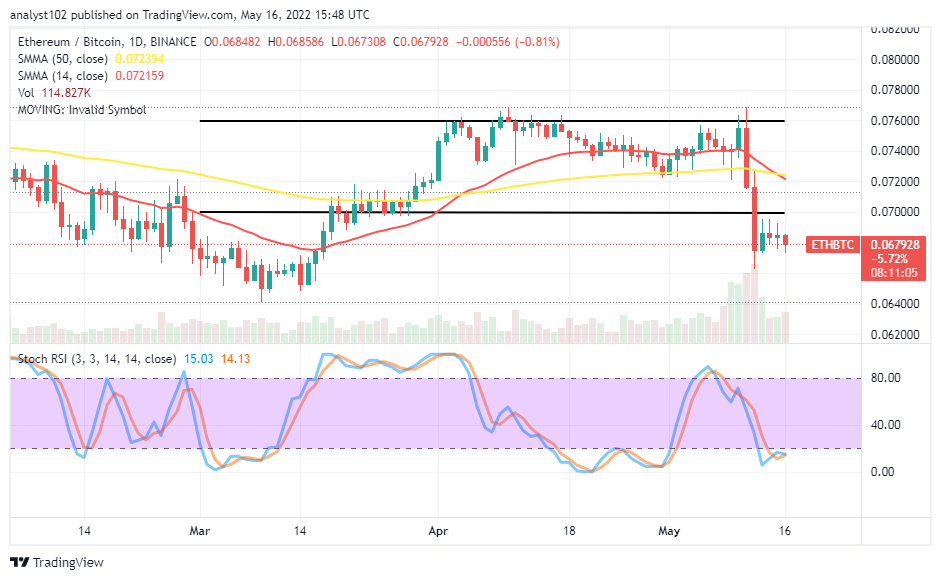
ETH/BTC Price Analysis
In comparison, Ethereum has significantly dropped in its trending stance against Bitcoin to align with what is obtainable in the general bearish trading condition in most crypto economies. The 14-day SMA indicator is attempting to intercept the 50-day SMA indicator from the top within the range-bound trading zones. The lower range line was breached to the south on the May 12th session, leading the cryptocurrency pair price to trade at a lower spot beneath. The Stochastic Oscillators are in the oversold region, seemingly trying to begin a consolidation moving manner within it. The base crypto may still push under depression by the countering flagship crypto for the time being in a less-active moving system.
Note: Cryptosignals.org is not a financial advisor. Do your research before investing your funds in any financial asset or presented product or event. We are not responsible for your investing results.
You can purchase Lucky Block here. Buy LBlock: