Polkadot (DOT/USDT) Poised for Recovery Amid Market Volatility
Estimated Reading Time: 3 minutes
Don’t invest unless you’re prepared to lose all the money you invest. This is a high-risk investment and you are unlikely to be protected if something goes wrong. Take 2 minutes to learn more
Polkadot Long-term Analysis: Ranging
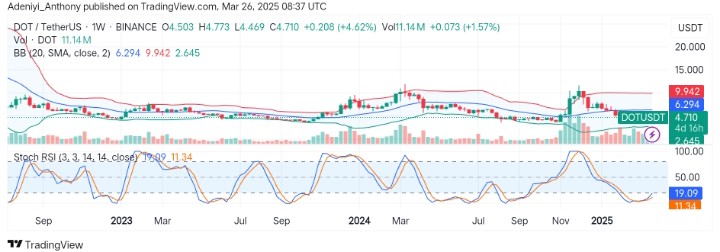
The polkadot against the Tether market has been seeing a period of consolidation followed by a sharp rally and subsequent correction since late last year. However, the pair appears to be trading near the mid-Bollinger bands at $6.294, reflecting some gains over the previous session.
Recently, Polkadot’s price action suggests a possible rebound as buying pressure increases, but the appearance of the pair within the lower segment of the bands shows the market is not totally controlled by the bulls. However, the signals from the oscillator indicate the pair is set for a long-term recovery.
Currently, Polkadot trades at $4.710, recording a moderate 11.14 million traded volumes for the week.
Technical Indicators
Major Resistance Levels: $6.294, $9.940, and $15.000
Major Support Levels: $4.000, $2.650, and $2.000
Polkadot Technical Analysis
The weekly analysis of Polkadot against the Tether shows that the pair is at an early recovery stage after a recent drop in price as the price tests the mid-line of the Bollinger bands. However, the bands are relatively tight, suggesting low volatility but a potential breakout in view.
On the other hand, the Stochastic oscillator indicates selling pressure is waning as the lines leave the oversold region. However, movement above the 30-mark level would signal a confirmed recovery; otherwise, an indecisive movement might continue under the $6.294 level.
DOT/USDT Analysis: What’s Happening Here?
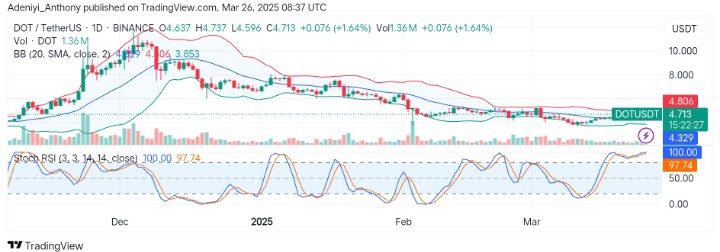
The daily chart of DOT/USDT shows that the pair is on short-term bullish momentum, with DOT trading within the tight Bollinger bands. However, recent price actions display activities towards the $4.806 upper limit as the pair hit past the middle band, recording 1.64% gains along the way.
On the other hand, the Stochastic RSI signals an overbought condition, suggesting a possible short-term pullback as the blue line hits 100.
To this end, a close above $4.806 could push the pair above $6.294. However, with the overbought condition of the market, the pair might experience a slight pullback before the continuation of the proposed uptrend.
You can purchase crypto coins here. Buy LBlock