Polkadot (DOT/USDT) Consolidates with Potential Price Recovery in View
Estimated Reading Time: 3 minutes
Don’t invest unless you’re prepared to lose all the money you invest. This is a high-risk investment and you are unlikely to be protected if something goes wrong. Take 2 minutes to learn more
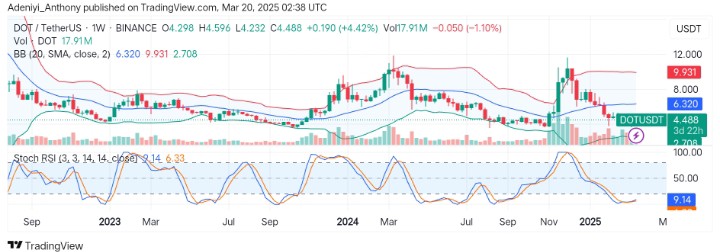
Polkadot Long-term Analysis: Ranging
The market for Polkadot against the Tether is currently in a consolidation phase after an extended downtrend. The pair appears to have been under significant selling pressure after hitting above $9.931 around the beginning of the year.
However, it looks like the market is stabilizing and attempting a bullish recovery, seeing a massive 4.42% gain for the week already. Despite this, the positioning of the pair around the lower band and the Stochastic oscillator warrants caution as the bullish momentum might be in its early stages.
Currently, Polkadot trades at $4,488 underneath the dynamic 20-SMA, with 17.91 million traded volumes.
Technical Indicators
Major Resistance Levels: $6.320, $8.000, and $9.931
Major Support Levels: $4.000, $3.200, and $2.708
Polkadot Technical Analysis
The weekly market analysis of Polkadot against the Tether shows that the market is currently eyeing a recovery above $6.320 as the market sees an increasing influx of traders for the week.
However, the price activities within the $2.000 and $6.000 levels show that the pair’s northbound journey is just beginning, as the indicator suggests move confirmations are needed.
On the other hand, the Stochastic RSI signals an oversold condition, suggesting a potential upside movement is ahead. However, the placement of the lines shows a potential improvement has already begun, but more buyers’ actions are needed to prevent an extended consolidation phase.
To this end, the price needs to break above $6.320 for a confirmed bullish move back to the $10.000 level; otherwise, the $3.200 level would be the next target if the price falls below the $4.000 support level.
DOT/USDT Analysis: What’s Next?
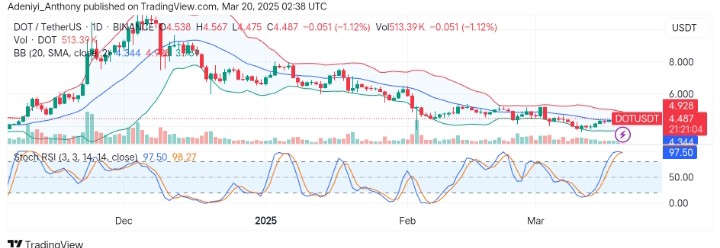
The analysis of DOT/USDT on a daily timeframe suggests the pair moves sideways after some recent upticks with low volatility as the Bollinger bands squeeze between the $4.000 and $3.000 levels.
On the other hand, the oscillator suggests bullish momentum may be waning as the lines signal a pullback is ahead. To this end, the price needs to hold above $4.300 for a good re-entry position; otherwise, a fall below this level could indicate a test of the $4.000 level.
You can purchase crypto coins here. Buy LBlock