Polkadot (DOT/USDT) Seeks to Break Above $2.539 Critical Level
Estimated Reading Time: 3 minutes
Don’t invest unless you’re prepared to lose all the money you invest. This is a high-risk investment and you are unlikely to be protected if something goes wrong. Take 2 minutes to learn more
Polkadot Long-term Analysis: Ranging
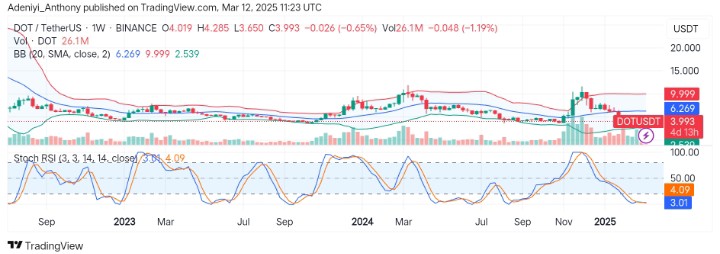
The market for Polkadot against the Tether, after forming a local high at the $10.000 level, has been dwindling to the south, slicing through each support.
Recently, the pair’s price has operated below the $6.269 dynamic level, suggesting an oversold condition. However, the operation of the lines of the Stochastic RSI indicates the price ranges and is ready for a breakout.
To this end, this oversold condition may trigger a bounce to the north in the coming session, but more bullish traders are needed.
Currently, Polkadot trades at $3.993 with a moderate 25.98 million traded volume.
Technical Indicators
Major Resistance Levels: $4.500, $ 5.000, and $6.269
Major Support Levels: $3.500, $2.539, and $2.000
Polkadot Technical Analysis
On a weekly timeframe, Polkadot against the Tether has been down-trending with several failed attempts at stabilization. The activities of the price below the mid-point of the Bollinger bands suggest bearish traders dominate the market. However, this also portrays an exhausted bearish momentum as the price nears the lower band at $2.539.
On the other hand, the Stochastic oscillator signals Polkadot’s value moves within a tight range as the lines extend forward without direction.
To this end, the pair needs more bullish efforts to break above $4.500 for a breakout to the north; otherwise, an advancement to the south will materialize with a break below $3.500.
DOT/USDT Analysis: What’s Next?
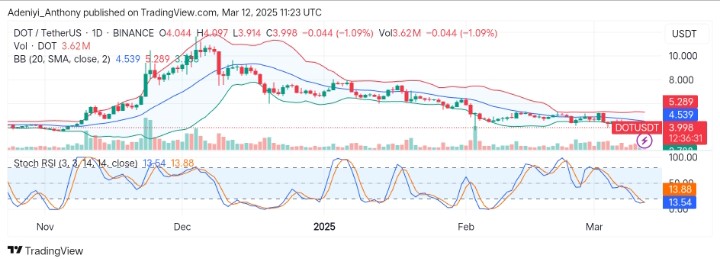
On the daily timeframe, DOT/USDT trades slightly above the lower band at $3.787 with signs of an impending expansion. However, the pair appears to be ticking to the south despite oversold conditions and recent efforts.
The Stochastic RSI, on the other hand, signals the pair may witness a short-term upside movement as the lines are about to confirm a bullish crossover.
To this end, a breakout to the top is expected if bullish traders push the price above $4.100; otherwise, a move below $3.500 may trigger another downward.
You can purchase crypto coins here. Buy LBlock