Polkadot (DOT/USDT) Eyes Recovery Above $6.218 Dynamic Level
Estimated Reading Time: 3 minutes
Don’t invest unless you’re prepared to lose all the money you invest. This is a high-risk investment and you are unlikely to be protected if something goes wrong. Take 2 minutes to learn more
Polkadot Long-term Analysis: Bearish
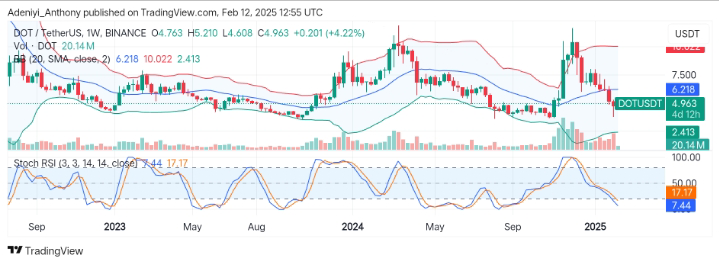
Polkadot against the Tether on the weekly timeframe has experienced a sharp decline in recent trading sessions, as seen in the price action after hitting the previous high around the $10.000 level. However, the price seems to be attempting a recovery as the pair records a 4.22% weekly gain.
Recently, the pair broke below the $6.218 level, trading almost at the same level as the previous support. However, with the formation of the current bullish candlestick with expanded Bollinger bands, the price may reclaim the 20-period moving averages.
Currently, Polkadot is trading at $4.963 with 20.14 million weekly traded volumes.
Technical Indicators
Major Resistance Levels: $6.218, $7.500, and $10.022
Major Support Levels: $4.000, $3.500, and $2.413
Polkadot Technical Analysis
The analysis of the Polkadot against the Tether (USDT) on a weekly timeframe shows the pair has been making attempts at recovery with the formation of a green candlestick beneath a downtrend.
Though the price acts under the 20-SMA line, the gain and volume for the week show the potential for more upside movement in the near term.
On the other hand, the Stochastic RSI operates deep in the oversold region, raising concerns as to the determination of the next movement. However, a bullish crossover is imminent as the current bearish momentum wanes.
To this end, the price needs to break above the $6.218 resistance for a sustained recovery toward the previous high; otherwise, a failed attempt below the dynamic line may lead to a movement to the south.
DOT/USDT Analysis: What’s Next?
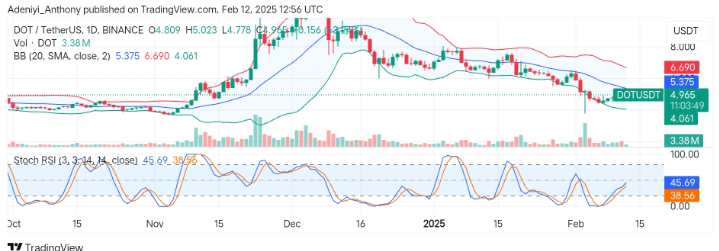
On the daily timeframe, DOT/USDT exhibits potential for a short-term recovery as the price moves closer to $5.573, showing a 3.24% daily gain.
However, the direction of the Bollinger bands shows the pair is on a downtrend, as the price seeks to move against the tides. Therefore, a break above the mid-band level would signal a confirmed reversal to the north; otherwise, a failed attempt at this level would indicate a movement towards $4.5000.
On the other hand, the Stochastic RSI indicates increasing bullish activities as the lines improve to the north. However, a break above the 50-mark level would cement further moves to the north.
You can purchase crypto coins here. Buy LBlock