Polkadot (DOT/USDT) Prepares for More Downtrend
Estimated Reading Time: 3 minutes
Don’t invest unless you’re prepared to lose all the money you invest. This is a high-risk investment and you are unlikely to be protected if something goes wrong. Take 2 minutes to learn more
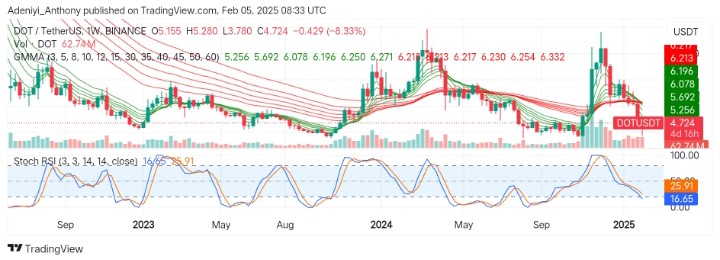
Polkadot Long-term Analysis: Bearish
The current market sentiment for Polkadot against the Tether appears to be bearish after it attempted recovery in the previous trading session. However, DOT faced strong selling pressure, as it sold below the last green EMAs at $5.256 after a bearish crossover.
To this end, traders await signs of potential continuation or reversal as the Stochastic RSI shows signs of possible exhaustion. However, further downward movement remains possible if key support levels are broken.
Currently, Polkadot trades at $4.724, with over 62 million traded volumes.
Technical Indicators
Major Resistance Levels: $5.256, $6.078, and $6.271
Major Support Levels: $4.500, $3.800, and $3.500
Polkadot Technical Analysis
On the weekly timeframe, Polkadot against the Tether (USDT) appears to be on a downtrend, acting under strong selling pressure, with the price piercing the support levels. However, the Guppy Multiple Moving Averages (GMMAs) show the trading well below the cluster of short-term moving averages, confirming a downtrend.
On the other hand, the Stochastic RSI signals the pair is in a consistent downtrend, as both lines of the oscillator read values lower than the 30-mark level. However, despite the oversold condition in the pair’s market, the oscillator’s position indicates a recovery might be on the horizon.
To this end, the price needs to stay above the $4.500 support level to see a rebound in the near term; otherwise, further deepening in price may be encountered.
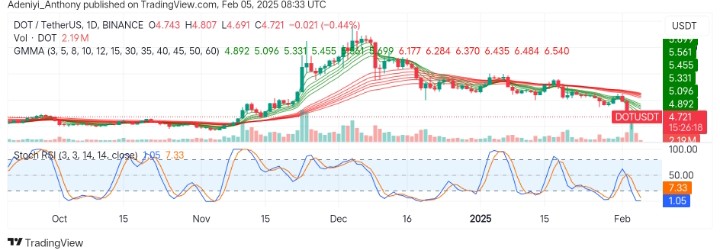
DOT/USDT Analysis: Expectations
On the daily timeframe, DOT/USDT reflects a continued bearish trend as the price broke below the critical level at $4.892. This suggests strong selling interest as the price hovers below the green EMAs after several failed attempts at recovery.
On the other hand, the Stochastic oscillator operates in the extreme oversold region. This suggests the strong selling pressure may be slowing down with no immediate signs of a reversal on the horizon as the trading volume increases.
To this end, a trade above $5.096 in the near term will determine if DOT/USDT will recover any time soon; otherwise, an increase in selling pressure would push the price further downward.
You can purchase crypto coins here. Buy Block


