Polkadot (DOT/USDT) Seeks to Break Above $5.95 Critical Level
Estimated Reading Time: 3 minutes
Don’t invest unless you’re prepared to lose all the money you invest. This is a high-risk investment and you are unlikely to be protected if something goes wrong. Take 2 minutes to learn more
Polkadot Long-term Analysis: Bearish
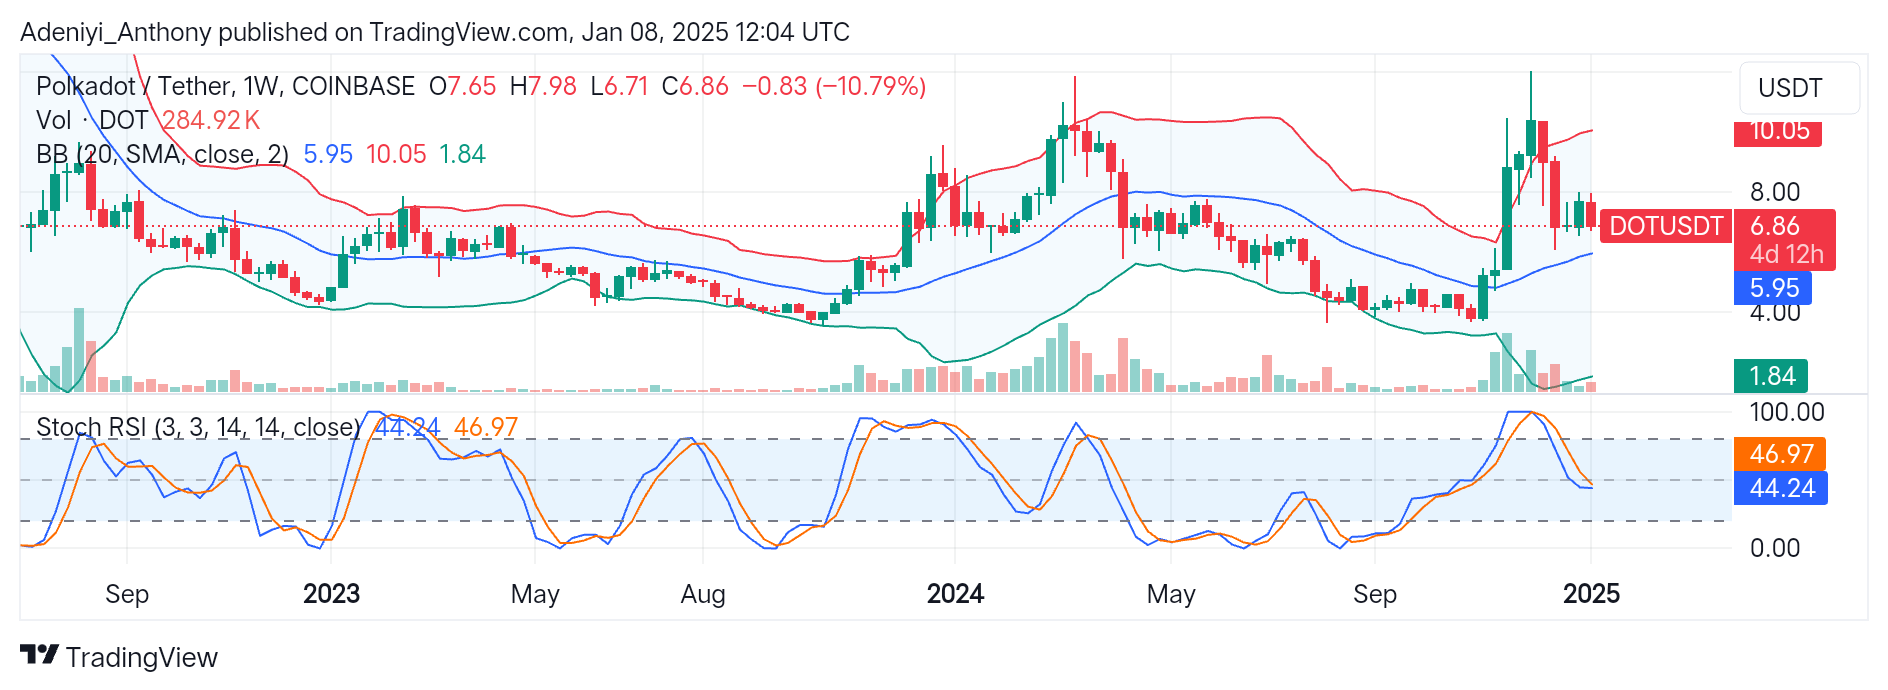
The weekly analysis of Polkadot (DOT) against the Tether (USDT) shows a bearish trend following a significant decline of 10.79% from the previous trading session. This drop is a continuation of recent downward pressure after the price fails to hold above the upper Bollinger band around $10.05.
However, the broader market sentiment appears cautious, with the Bollinger bands showing a sign of contraction, indicating reduced volatility. Meanwhile, the Stochastic RSI suggests selling pressure may be waning, signaling the possibility for a reversal or the continuation of range-bound activities before a clear direction emerges.
Currently, Polkadot trades at $6.86 with a low weekly volume of 284.92 thousand, signifying low market participation.
Technical indicators
Major Resistance Levels: $7.50, $8.00, and $10.05
Major Support Levels: $5.95, $4.80, and $1.84
Polkadot Technical Analysis
The weekly analysis of Polkadot shows that the coin is bearish, but with a signs of potential reversal or consolidation are emerging as the price approaches the $5.95 level. However, a break below the mid-band would align with the continuation of the bearish trend, especially if the lines of the oscillator remain bearish below the 40-mark level.
On the other hand, the contraction of the bands shows that the end of a downtrend is near. Therefore, a reversal towards previous highs depends on increased volume and price upside movement above $7.50.
Additionally, this action suggests improved Stochastic lines, as both lines seem to be converging. An improvement above the 50-mark level would indicate the start of an uptrend.
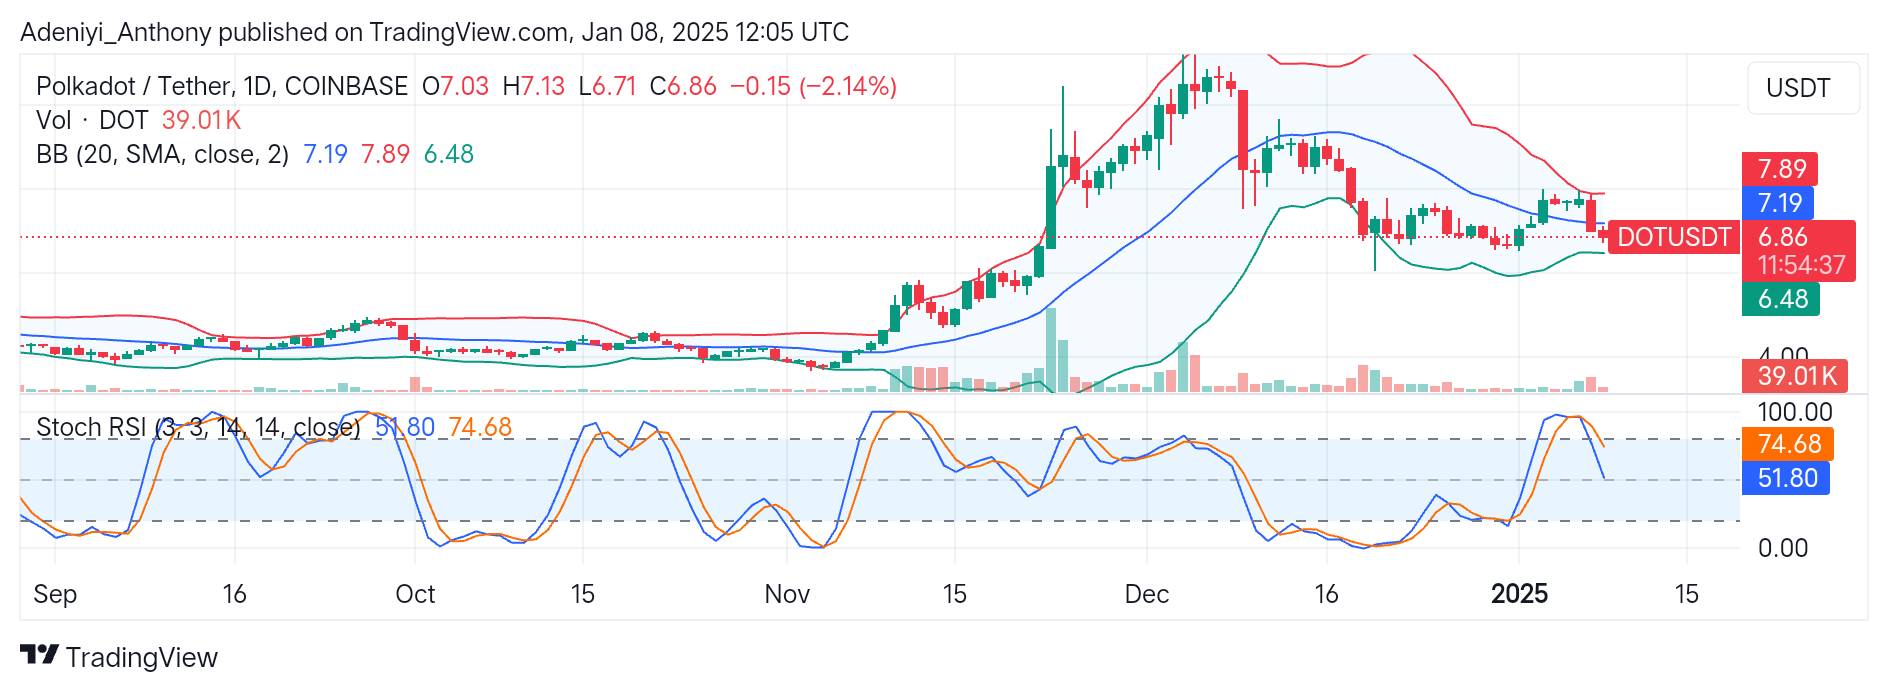
DOT/USDT Analysis: A Continued Downtrend or Reversal?
On the daily timeframe, the chart indicates a sideways movement with the price operating 2.14% below the previous daily candle and the 20-day SMA line. This recent price action suggests a strong bearish momentum. However, the tightened bands signal an impending expansion in the near term.
On the other hand, the Stochastic oscillator suggests the pair is trending downward, signaling a short-term selling pressure unless a bullish crossover surfaces.
To this end, with an increased volume, a bounce above $6.86 would signal a move towards $7.50. Conversely, a break below $5.95 would confirm more bearish movement.
You can purchase crypto coins here. Buy LBlock