Compound (COMP/USD) Battles to Defend $70 Support Amid Bearish Pressure
Estimated Reading Time: 3 minutes
Don’t invest unless you’re prepared to lose all the money you invest. This is a high-risk investment and you are unlikely to be protected if something goes wrong. Take 2 minutes to learn more
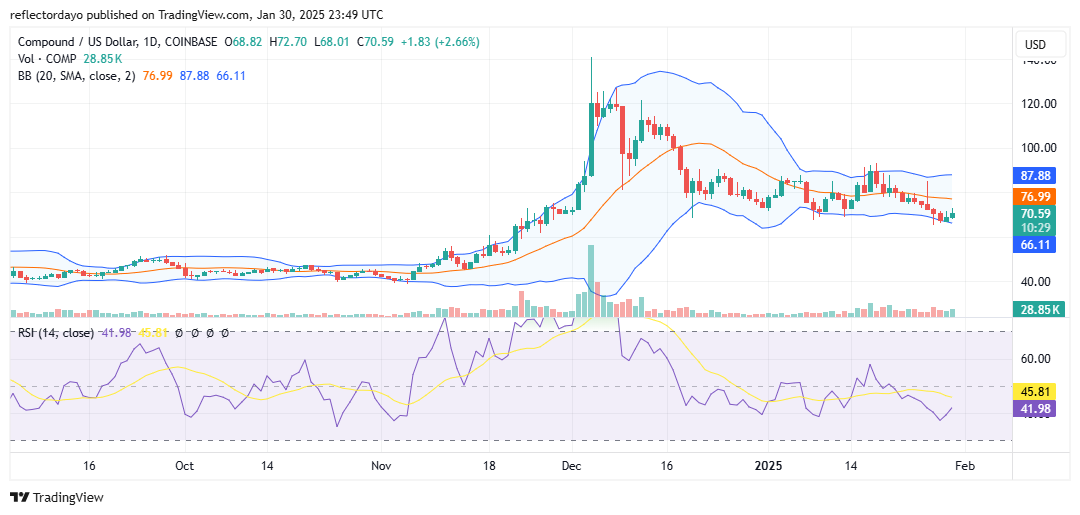
The Compound (COMP/USD) market initially maintained its movement within the $70 to $90 price range. While this horizontal channel is relatively broad, reflecting the market’s volatility as price swings between the key support at $70 and the key resistance at $90, the volatility was even stronger earlier. This heightened volatility was driven by a strong bullish momentum in early December of last year. However, the subsequent bearish trend also gained significant strength, capitalizing on the prior bullish rally. The last major bull run pushed the price to a peak of approximately $130.
Compound Market Data
- COMP/USD Price Now: $70.46
- COMP/USD Market Cap: $625.7 million
- COMP/USD Circulating Supply: 8.86 million COMP
- COMP/USD Total Supply: 10 million COMP
- COMP/USD CoinMarketCap Ranking: #128
Key Levels
- Resistance: $80, $0.90, and $100
- Support: $65, $60, and $55.
The Compound Market Through the Lens of Indicators
Following a period of massive profit-taking, bulls initially attempted to regain control around the $80 price level. However, they were unable to withstand the intense bearish pressure at that level, forcing them to retreat and regroup below $70. This shift in the crypto signal contributed to an increase in Bollinger Bandwidth, reflecting heightened market volatility.
Recently, sustained bearish pressure has put the $70 support level at risk. Although bulls briefly lost their grip, they quickly rallied the price back above $70. Despite this recovery, the current price action remains under pressure, as indicated by the upper shadow on the latest bullish candlestick, which signals persistent selling pressure.
At the moment, bulls are holding the $70 level, and if their resilience continues, the market could remain range-bound around this price until bearish momentum fades.
COMP/USD Price Prediction: 1-Hour Chart Analysis
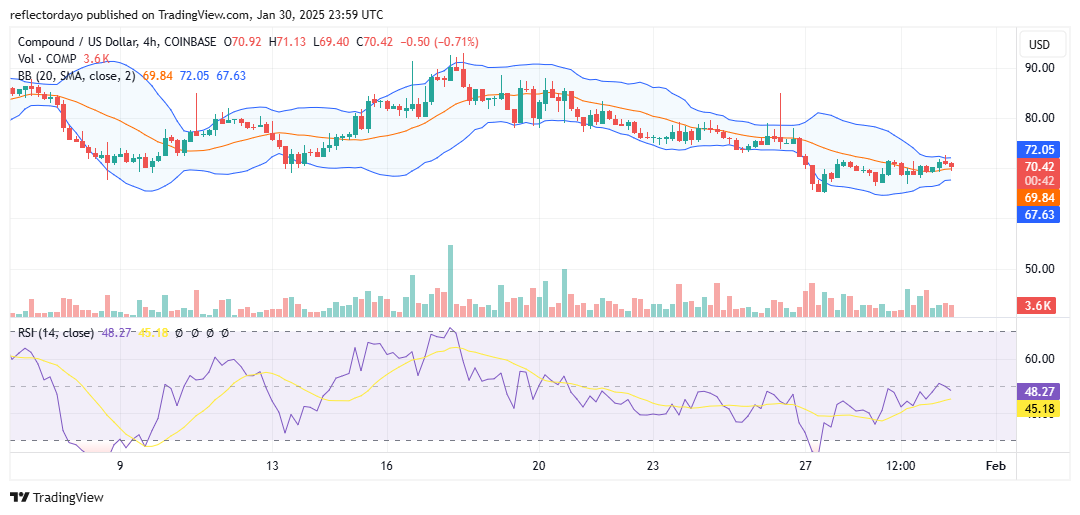
The 4-hour chart of the Compound (COMP/USD) market indicates a convergence between bullish and bearish levels slightly above $70, signaling the emergence of a consolidation phase. The RSI line is currently hovering around the midpoint, suggesting a potential continuation of price consolidation above $70.
Additionally, the Bollinger Bands are contracting, indicating a volatility squeeze that is likely to manifest on the daily chart. Such a squeeze often precedes a breakout or breakdown, making it crucial for traders to remain vigilant. A breakdown below $70 could trigger increased bearish sentiment, reinforcing downside momentum.