Ondo Finance (ONDO/USD) Holds Strong Above $2.00: Is the Bullish Momentum Still Intact?
Estimated Reading Time: 3 minutes
Don’t invest unless you’re prepared to lose all the money you invest. This is a high-risk investment and you are unlikely to be protected if something goes wrong. Take 2 minutes to learn more
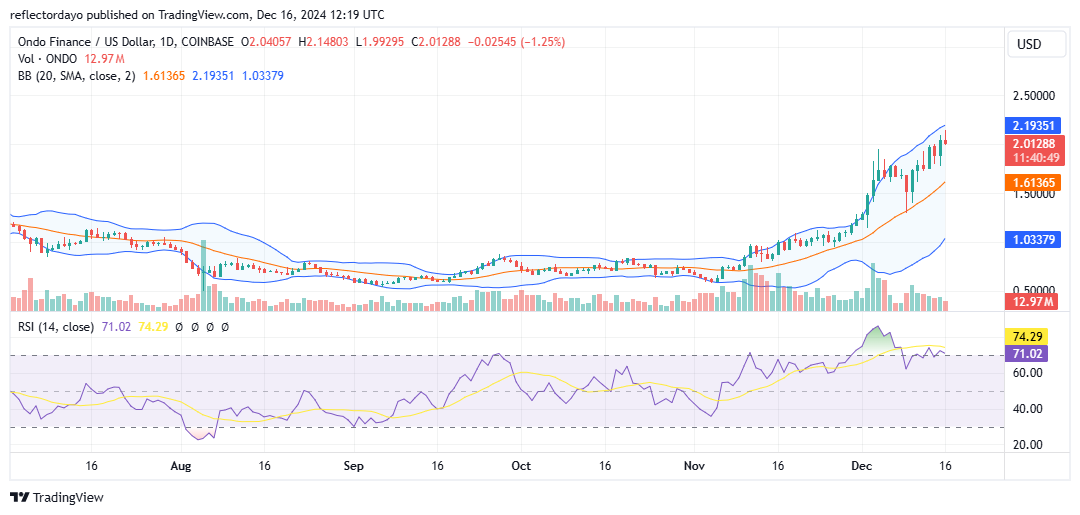
Since late November through early December, the Ondo Finance market has exhibited relentless bullish momentum. It recently overcame a period of indecision around the $1.64 price level. During this phase of struggle, it seemed likely that the market might break down, as the Relative Strength Index (RSI) indicated a significant overbought condition. However, instead of a breakdown, the market staged a breakout, with prices surging sharply to the upside.
Now, the market has reached a new high of $2.00, where bearish pressures are beginning to converge. The critical question remains: will recent history repeat itself at this level, or will bearish forces take control?
The Ondo Finance Market Data
- ONDO/USD Price Now: $2.00
- ONDO/USD Market Cap: $2.2 billion
- ONDO/USD Circulating Supply: 1.38 billion
- ONDO/USD Total Supply: 10 billion ONDO
- ONDO/USD CoinMarketCap Ranking: #62
Key Levels
- Resistance: $2.20, $2.50, and $3.00
- Support: $1.60, $1.50, and $1.40.
The Ondo Finance Market Through the Lens of Indicators
Since mid-November, the Ondo Finance market has consistently traded above the 20-day moving average, indicating that bulls have maintained strong dominance. Recently, the Relative Strength Index (RSI) highlighted an overbought condition, which bears attempted to exploit, leveraging the market’s volatility to trigger a potential downturn. However, renewed buying interest at the $1.50 price level reignited bullish momentum, pushing the price back into action and breaking into a new price zone around the $2.00 level.
One potential indicator of a price correction is the appearance of a shooting star candlestick above the $2.00 level. This candlestick pattern, characterized by a small body and a long upper shadow, typically forms after an uptrend and signals a possible reversal to the downside. Despite this crypto signal, the bulls’ ability to rebound strongly from $1.50 and sustain the price above the 20-day moving average suggests that they may defend their position and continue driving the market higher.
However, with the RSI hovering near the 70 level and the presence of the shooting star, traders are advised to exercise caution. Waiting for a clear signal of upward trend continuation before taking new positions would be a prudent approach.
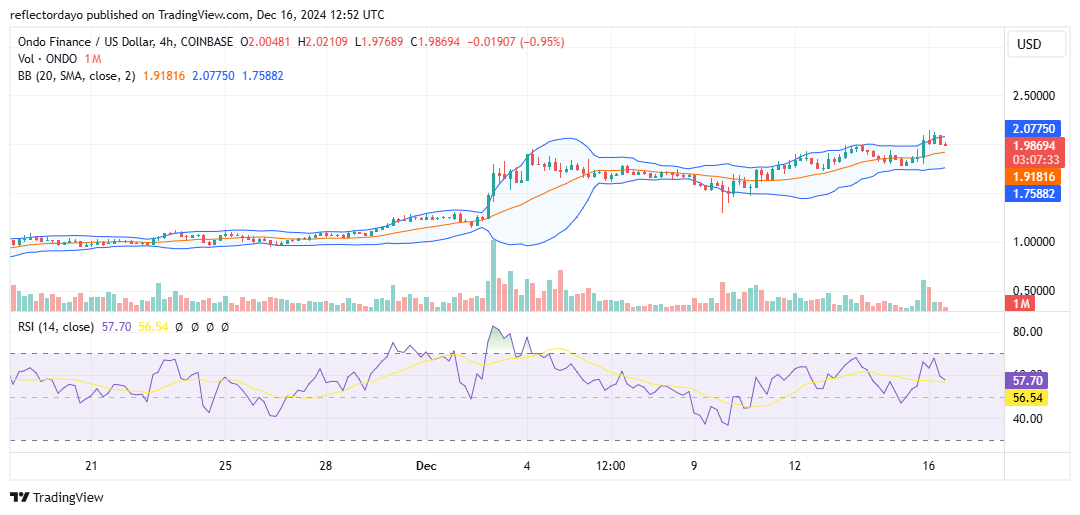
ONDO/USD Price Prediction: 4-Hour Chart Analysis
In the 4-hour chart, the market is clearly in a bullish trend, characterized by the formation of higher lows. The most recent higher low has emerged above the $2.00 price threshold, signaling a potential continuation of the bullish run. However, at present, the market appears to be in a state of equilibrium around the $2.00 level.
Given the historical behavior of this market, there is a strong likelihood of a bounce that could propel the price further upward, continuing the prevailing bullish trend. Traders should monitor the price action closely for confirmation of this potential upward movement.