Ethereum (ETH) Is In a Range Bound Move below $2,150 Resistance
Estimated Reading Time: 2 minutes
Don’t invest unless you’re prepared to lose all the money you invest. This is a high-risk investment and you are unlikely to be protected if something goes wrong. Take 2 minutes to learn more

Ethereum Price Long-Term Analysis: Bullish
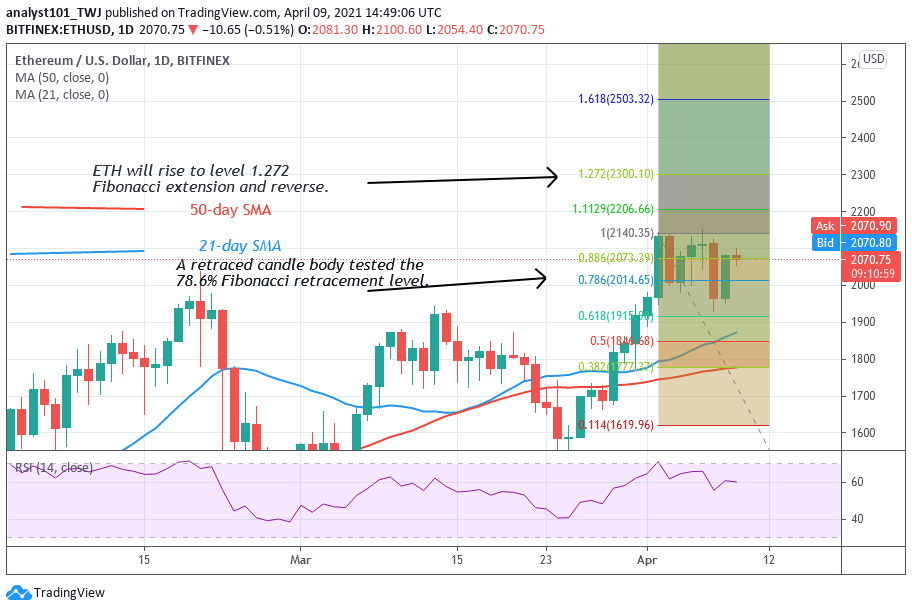
Since April 2, Ether’s price has been stalled below the $2,150 resistance. The market now fluctuates between $2,000 and $2,150. ETH/USD is consolidating near the resistance zone of the market. Consolidation near the resistance zone increases the chances of a breakout on the upside. Meanwhile, on April 3, a retraced candle body tested the 78.6% Fibonacci retracement level. It indicates that the market will rise to level 1.272 Fibonacci extensions or the high of $2,303.32.
Ethereum Indicator Analysis
Ether is at level 59 of the Relative Strength Index period 14. It indicates that ETH is in the uptrend zone and above the centerline 50. The 21-day and 50-day SMA are sloping on the upside indicating the uptrend. The biggest altcoin is above the 75% range of the daily stochastic. The biggest altcoin is approaching the overbought region.
Technical indicators:
Major Resistance Levels – $2, 500, $2,700, $2,900
Major Support Levels – $1.500, $1, 300, $1,100
What Is the Next Direction for Ethereum?
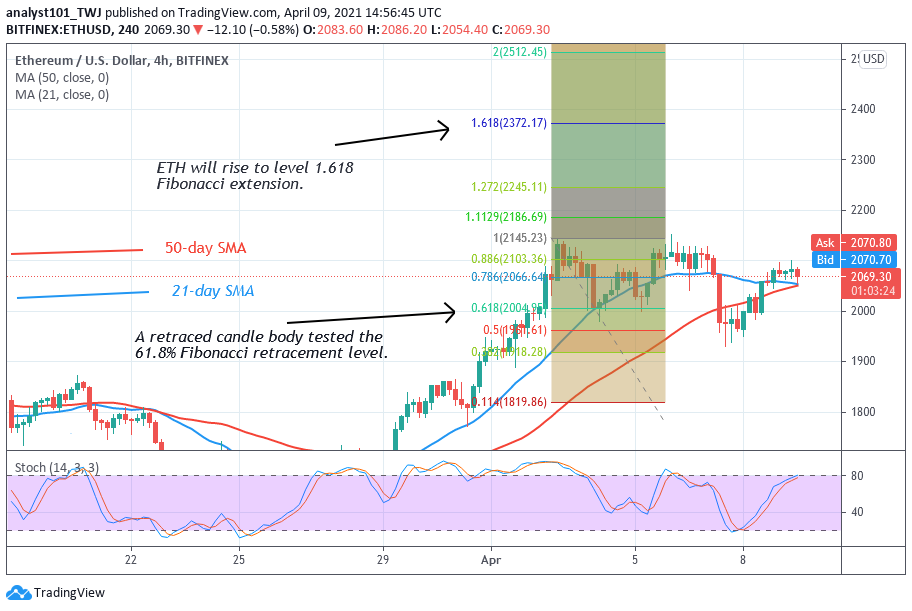
On 4- hour Chart, Ethereum is in a range bound move as the altcoin trades below the overhead resistance. On April 2 uptrend; a retraced candle body tested the 78.6% Fibonacci retracement level. The candle body tested the retracement twice on April 3 and 7. This indicates that the market will rise to level 1.618 Fibonacci extension or the high of $2,372.17.
Note: cryptosignals.org is not a financial advisor. Do your research before investing your funds in any financial asset or presented product or event. We are not responsible for your investing results