Oversold Condition Signal Flashes as XRP Price Targets the $2.000 Level
Estimated Reading Time: 4 minutes
Don’t invest unless you’re prepared to lose all the money you invest. This is a high-risk investment and you are unlikely to be protected if something goes wrong. Take 2 minutes to learn more
Over the last 24 hours, it appears that XRP has risen by 1.60%, recovering after a major partnership event between Ripple and Riyadh Bank. As it stands, this collaboration focuses on Saudi Arabia’s blockchain infrastructure, specifically enhancing cross-border payments and asset tokenization, and this price action reflects such a move as utility improves.
Technically, XRP against Tether has successfully tested support at $1.82, suggesting a triggered bullish rebound that aligned with a broader 1.16% lift in the global crypto market. Right now, the $1.88 resistance level stands as immediate resistance, and a cross above this level will make XRP capitalize on improved risk sentiment to maintain its positive 30-day growth trajectory.
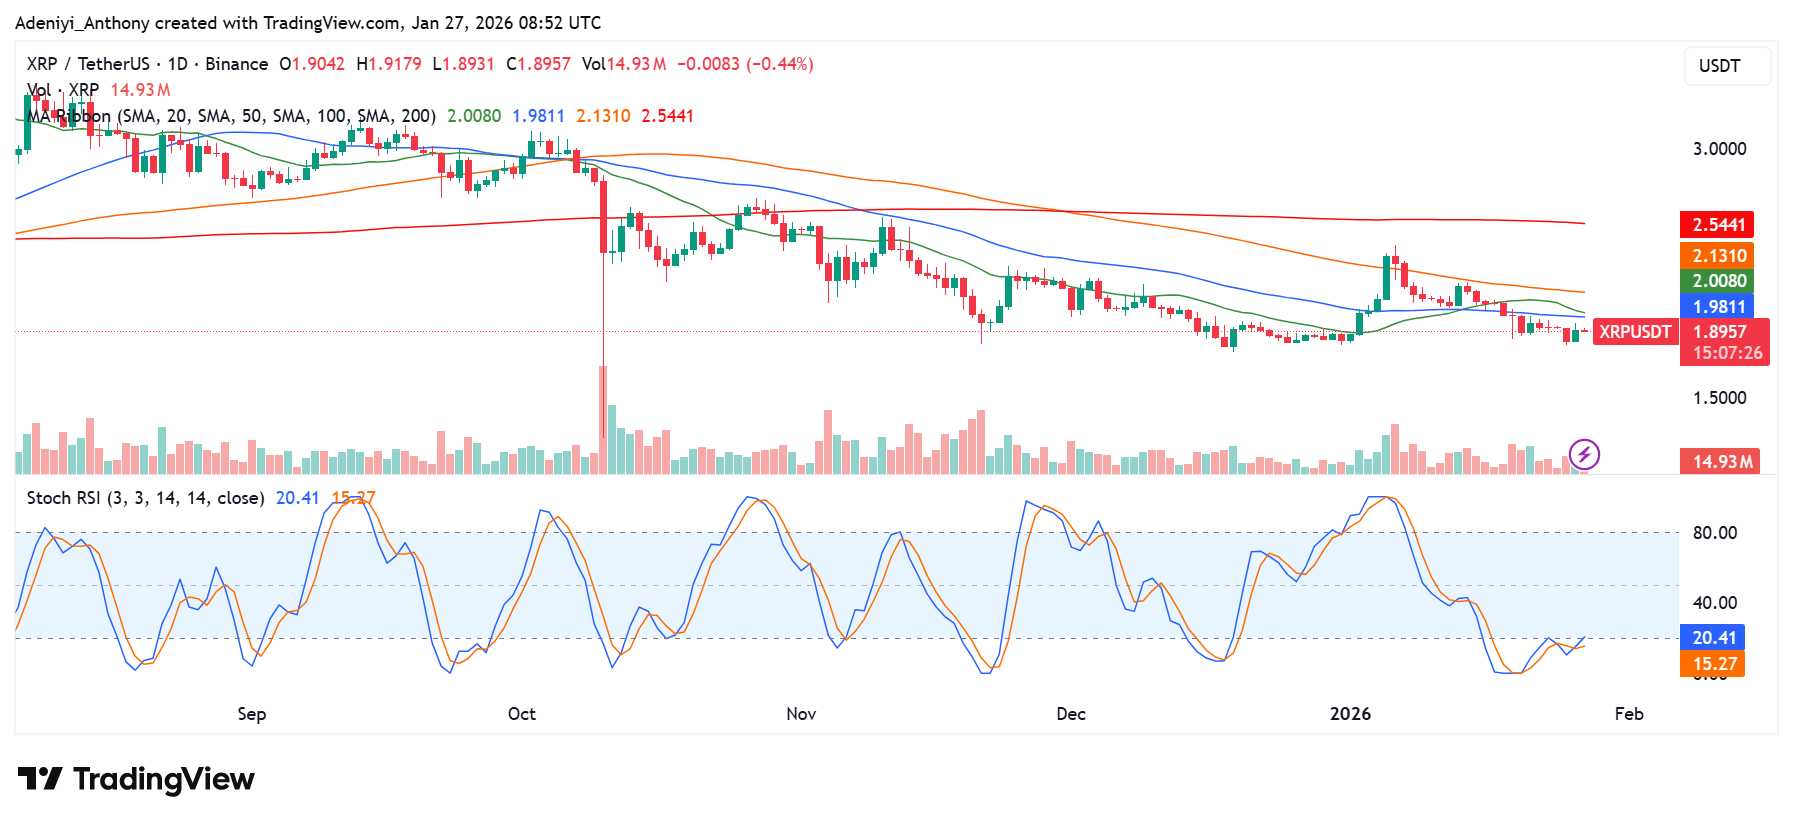
Currently, XRP trades at $1.8957 with over 14 million traded volumes on the daily timeframe.
Technical Indicators
Major Resistance Levels: $1.9811, $2.1310, and $2.5441
Major Support Levels: $1.8952, $1.8000, and $1.7500
Technical Analysis
Technically, the XRP price seems to be consolidating under a tightening range between the SMA 50 ($1.8952) and the SMA 20 ($1.9811). Meanwhile, the Moving Average Ribbon showed a bearish alignment, with the SMAs pointing southeast. This indicates that the prevailing trend remained cautious.
However, the Stochastic RSI on the daily timeframe was positioned at 20.41 (K) and 15.27 (D), suggesting that the token seems to be bouncing off from the oversold territory. This technical setup suggests mean reversion or a relief bounce, provided the support at the SMA 20 holds on a closing basis.
XRP Price Update Before the Next Breakout Attempt
XRP against Tether seems to be in a complicated situation, correcting as the XRP price appears to be choppy within Elliot Wave structures. While a potential micro five-wave advance is forming on the 30-minute chart, the overall trend remains a downtrend. As it stands, the key resistance level is $1.96–$1.97; staying below this keeps the bearish yellow pathway valid.
However, a break above $1.96 would signal a more complex “WXY” corrective structure rather than a simple ABC decline. Meanwhile, a true bullish breakout requires clearing the $1.96–$2.83 range. Until then, price movement is considered noise within a year-long range.
XRP/USDT Analysis: Volatility Spikes as XRP Price Consolidates Near $2.000
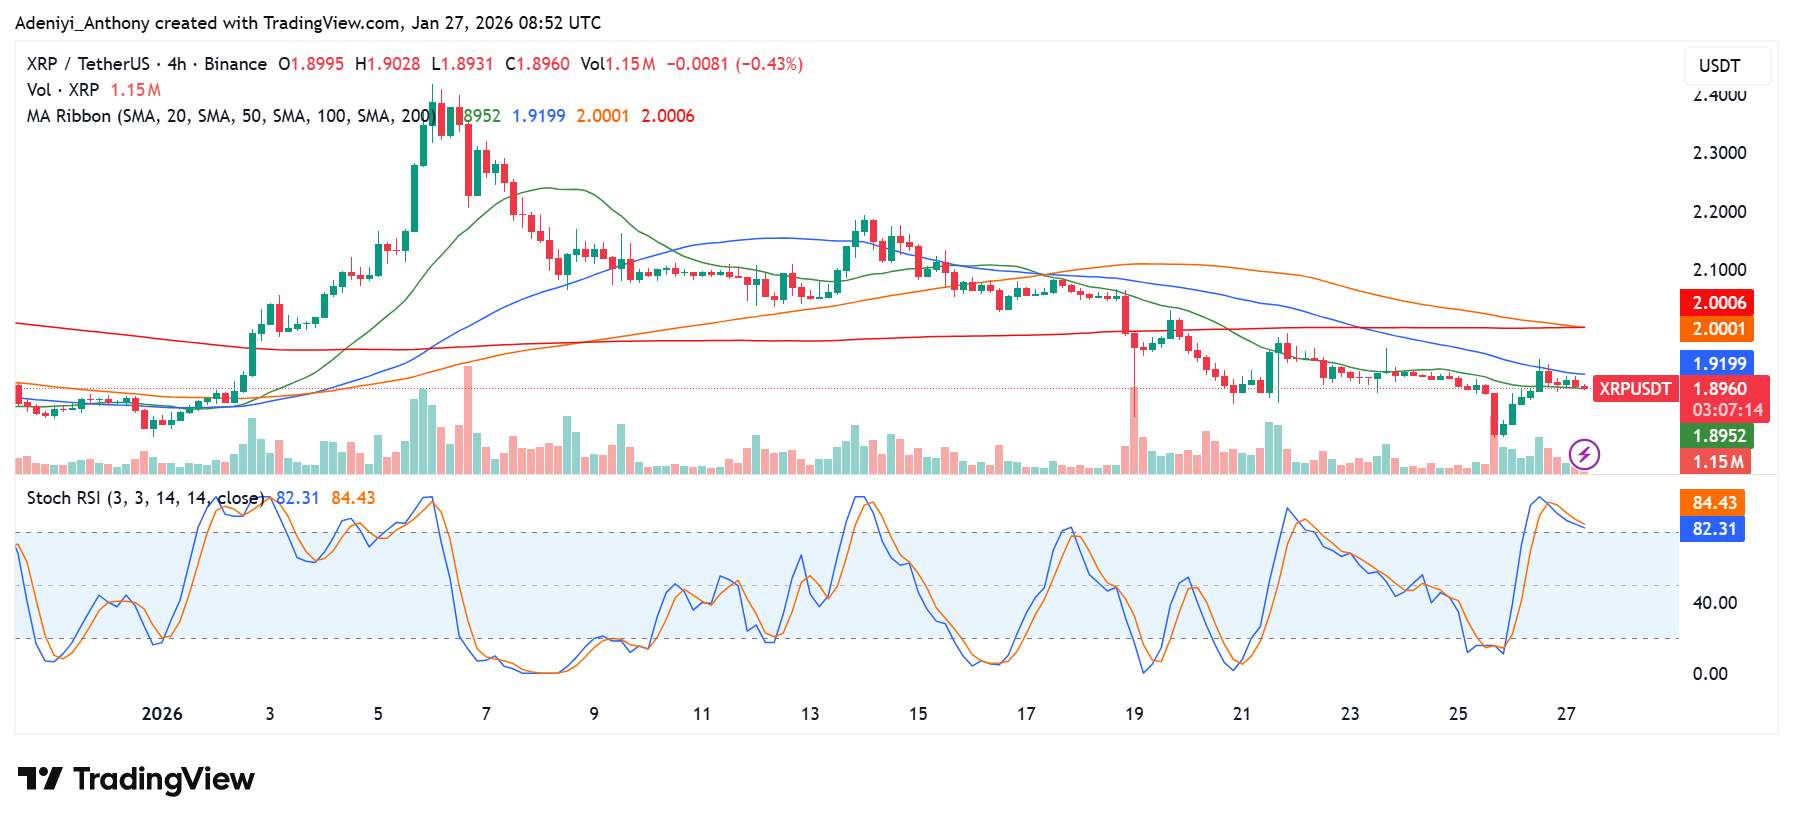
The 4-hour chart analysis revealed that the XRP price was hovering within the SMA 20 ($1.8952) and the 50 SMA (1.9919), finding it to give a trend. However, unlike the daily chart, the Stochastic RSI on the 4-hour timeframe showed a different story, with values at 82.31 and 84.43, indicating that the short-term momentum is dropping.
This divergence suggested that while a bounce was possible from the daily oversold conditions, a minor rejection or consolidation might occur first on the 4-hour level before a sustained move toward the SMA 50 at $1.9199 could be achieved.
To this end, the volume remains relatively stable, indicating that a decisive breakout or breakdown would likely require a fresh fundamental catalyst.
You can purchase crypto coins here. Buy Crypto