Cardano (ADA/USDT) Eyes Potential Price Recovery Amid Growing Concerns
Estimated Reading Time: 3 minutes
Don’t invest unless you’re prepared to lose all the money you invest. This is a high-risk investment and you are unlikely to be protected if something goes wrong. Take 2 minutes to learn more
Cardano Long-term Analysis: Bullish
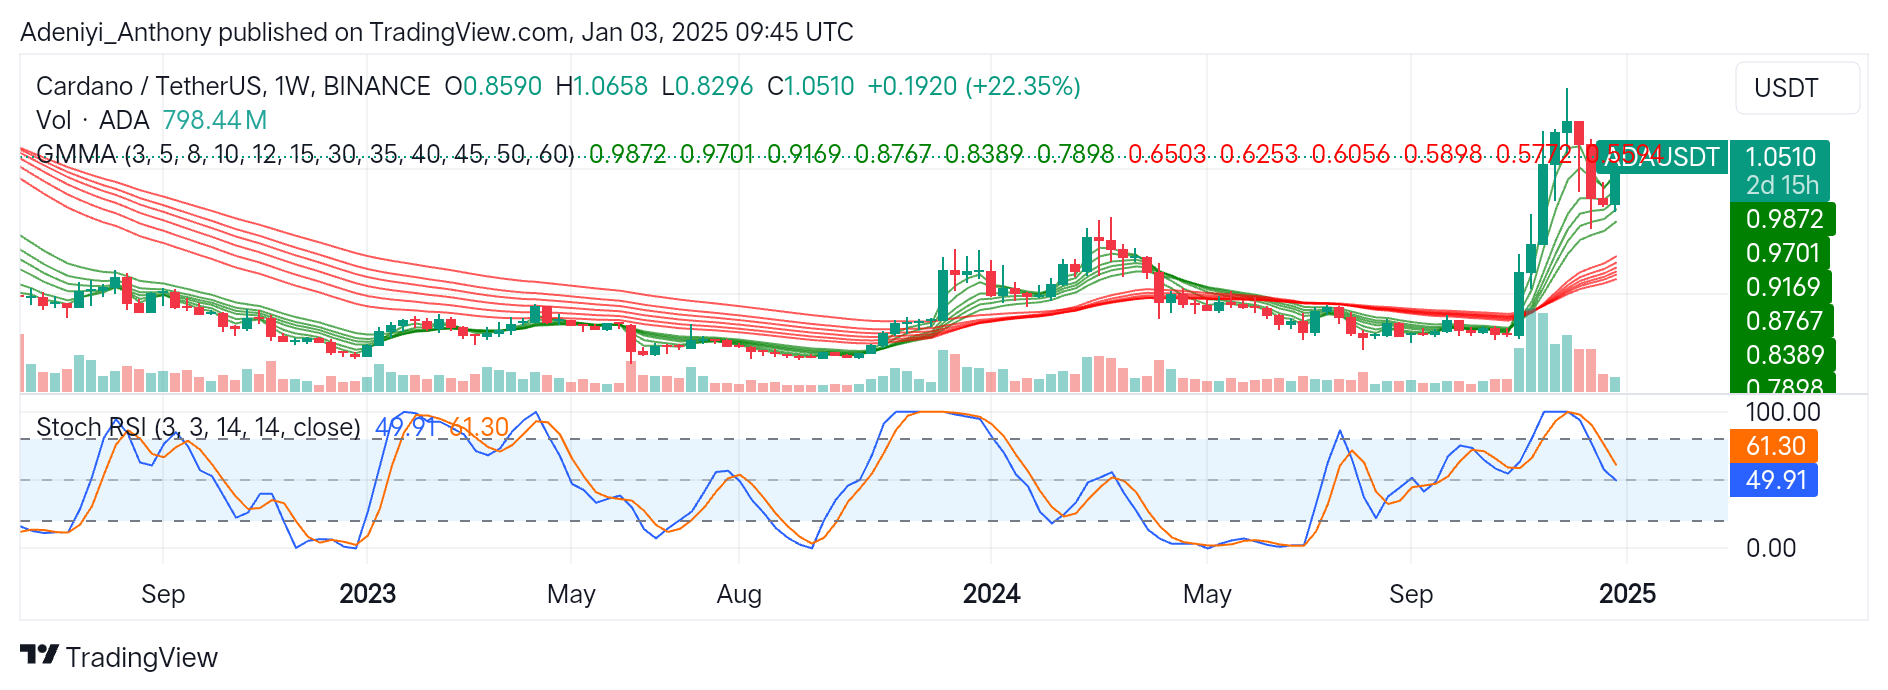
The market for Cardano (ADA) against the Tether (USDT) has seen significant volatility in recent times, with a sharp price deepening towards $0.9872 after a prolonged uptrend a month ago.
Recently, Cardano has exhibited resilience, signaling potential for a sustained uptrend following a sharp correction in previous weeks. However, the Stochastic RSI on the chart suggests a need for further confirmation as the lines operate in the neutral position.
Currently, Cardano operates at $1.0510, having seen a 22.35% weekly increase, with over 798.44 million traded volumes.
Technical Indicators
Major Resistance Levels: $1.0658, $1.2000, and $1.4000
Major Support Levels: $0.9700, $0.8389, and $0.7898
Cardano Technical Analysis
The analysis of Cardano against the Tether shows potential signs of peak recovery, with the formation of a long-wick bullish candlestick, signaling strong buying pressure. Moreover, the Guppy Multiple Moving Averages (GMMAs) seem to diverge upward, signaling more momentum is needed for a sustained recovery.
However, the recent bearish crossover of the Stochastic RSI suggests caution, as further downside movement of the lines could lead to a short-term pullback.
To this end, with an increasing trading volume and the candlestick formation, a sustained bullish pressure above $1.0658 is expected to materialize. However, caution is needed as the oscillator signals a pullback might be around the corner.
ADA/USDT Analysis: What’s Next?
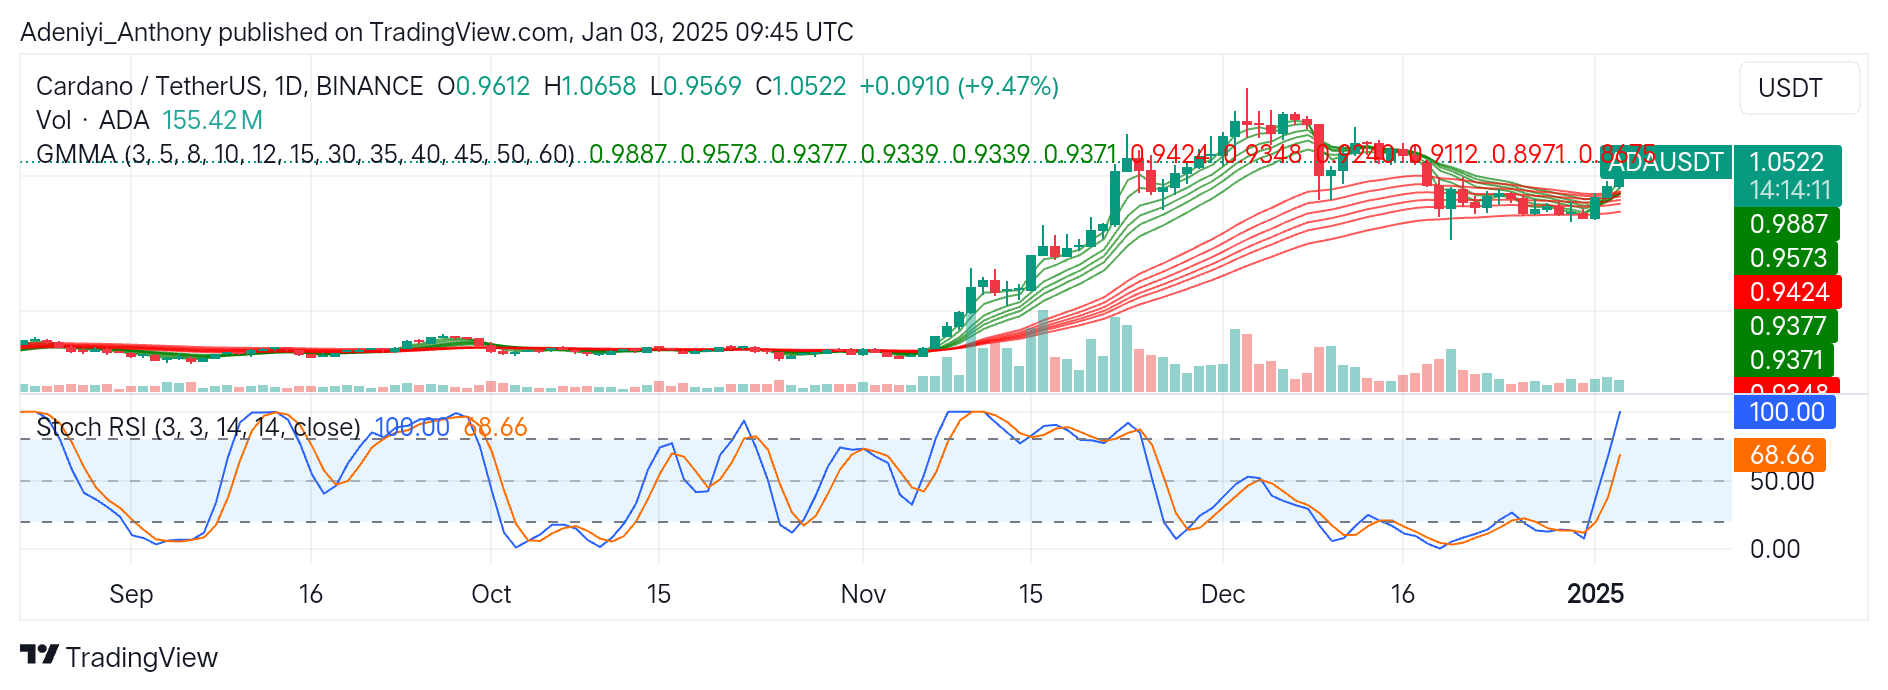
On the daily timeframe, ADA/USDT has recorded a gain of 9.47% highlighting strong bullish momentum and increased buying interest. This is further reinforced by the current bullish crossover of the EMAs, with buyers dominating the market.
However, the oscillator at the bottom indicates an extreme uptrend, which can be later translated to potential exhaustion of the current trend in the near term.
To this end, a price movement above the previous high at $1.0658 could open the path to $1.2000. Conversely, a waned buying pressure could cause the price to break below $0.9887 due to the overbought condition.
You can purchase crypto coins here. Buy LBlock