Quant Price Prediction: QNT/USD Slides to $132 Support; What Next?
Estimated Reading Time: 3 minutes
Don’t invest unless you’re prepared to lose all the money you invest. This is a high-risk investment and you are unlikely to be protected if something goes wrong. Take 2 minutes to learn more
Quant Price Prediction – February 23
The Quant price prediction shows that QNT could retreat a little before crossing above the 9-day and 21-day moving averages.
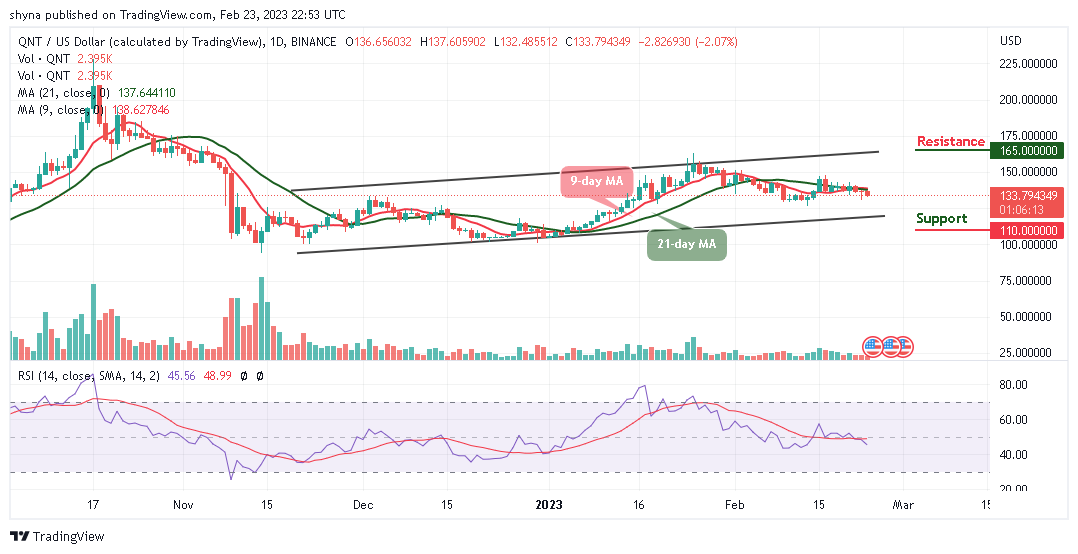
QNT/USD Long-term Trend: Ranging (Daily Chart)
Key levels:
Resistance Levels: $165, $175, $185
Support Levels: $110, $100, $90
QNT/USD is hovering around $133.79 as buying pressure cooled off a little. The market price could form a low at nearly $130 before heading to the upside. As of now, the Quant price stays below the 9-day and 21-day moving averages as the new buyers are expected to come into the market while the existing buyer is to buy the dips.
Quant Price Prediction: What to Expect from Quant (QNT)
The Quant price is presently correcting lower, and a decisive breakout below $130 support may intensify selling pressure. However, according to the chart, buyers and sellers were struggling with each other as the price keeps hovering below the 9-day and 21-day moving averages. Should in case there is a breakout above this barrier, the Quant price will increase to the resistance level at $140, which may increase to $150.
However, bulls need massive liquidity and volume to move near the upper boundary of the channel. The technical indicator Relative Strength Index (14) is seen crossing below the 50-level as the sharp downward slope is a clear indication of the influence, which may allow more investors to come into the market.
Meanwhile, a persistent bullish cross above the upper boundary of the channel could technically push the coin to the resistance levels of $165, $175, and $185, while the supports could be located at $110, $100, and $90.
QNT/USD Medium-Term Trend: Ranging (4H Chart)
Looking at the 4-Hour chart, the Quant price has not yet slipped below the lower boundary of the channel but is in the loop of making a bounce back above the 9-day and 21-day moving averages. Meanwhile, the Quant price hovers below the moving averages and could trade above the resistance level of $140.
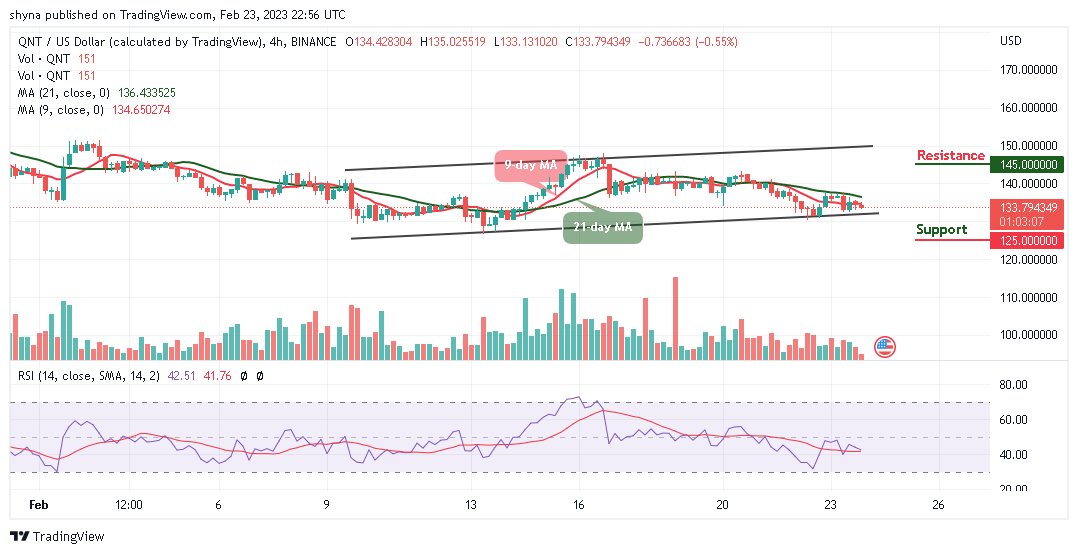
However, if the bulls energize the market, the price may hit the resistance level of $145 and above. Nevertheless, if the bears hold the price and drag it downward, the support level of $125 and below could be visited as the Relative Strength Index (14) remains below the 50-level; more buyers are expected in the market.
Place winning Quant trades with us. Get QNT here