Quant Price Prediction: QNT/USD Is Ranging, Price Could Take Support From $130
Estimated Reading Time: 3 minutes
Don’t invest unless you’re prepared to lose all the money you invest. This is a high-risk investment and you are unlikely to be protected if something goes wrong. Take 2 minutes to learn more
Quant Price Prediction – February 22
The Quant price prediction will begin to form higher as soon as the coin crosses above the 9-day and 21-day moving averages.
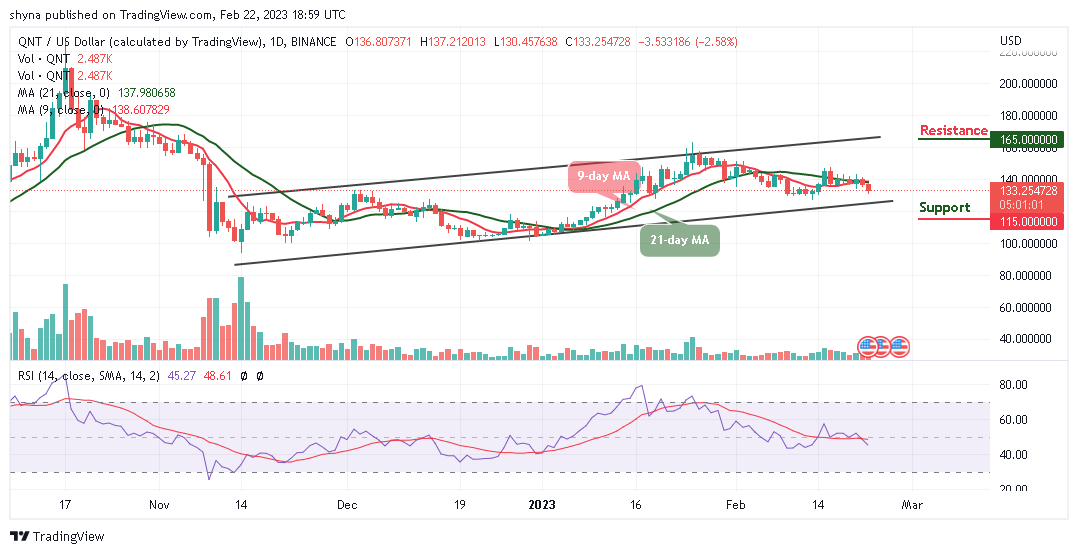
QNT/USD Medium-term Trend: Bullish (1D Chart)
Key Levels:
Resistance levels: $165, $175, $185
Support levels: $115, $105, $95
QNT/USD is hovering below the 9-day and 21-day moving averages, but it’s yet to head to the upside. At the time of writing, the market price is hovering at $133.25, and it could become cheaper to allow new investors to come into the market before facing the upside.
Quant Price Prediction: QNT/USD Will Retrace Back to the Top
The Quant price will make a retracement back above the 9-day and 21-day moving averages as soon as the bulls defend the support at the $130 level. However, if the bulls begin to push the coin toward the upper boundary of the channel, it could hit the potential resistance levels of $165, $175, and $185 respectively.
In other words, the current analysis could be delayed if the brings price below the lower boundary of the channel, it could fall to the support levels of $115, $105, and $95. Meanwhile, the technical indicator Relative Strength Index (14) crosses below the 50-level to prepare the coin for the bullish movement in the next positive direction.
QNT/USD Medium-term Trend: Ranging (4H Chart)
Looking at the 4-hour chart, the Quant price is hovering below the 9-day and 21-day moving averages. This is for the new buyers to come into the market and the existing buyers to re-invest. Meanwhile, the long-term moving averages will begin the bullish movement as the market prepares for a new trend.
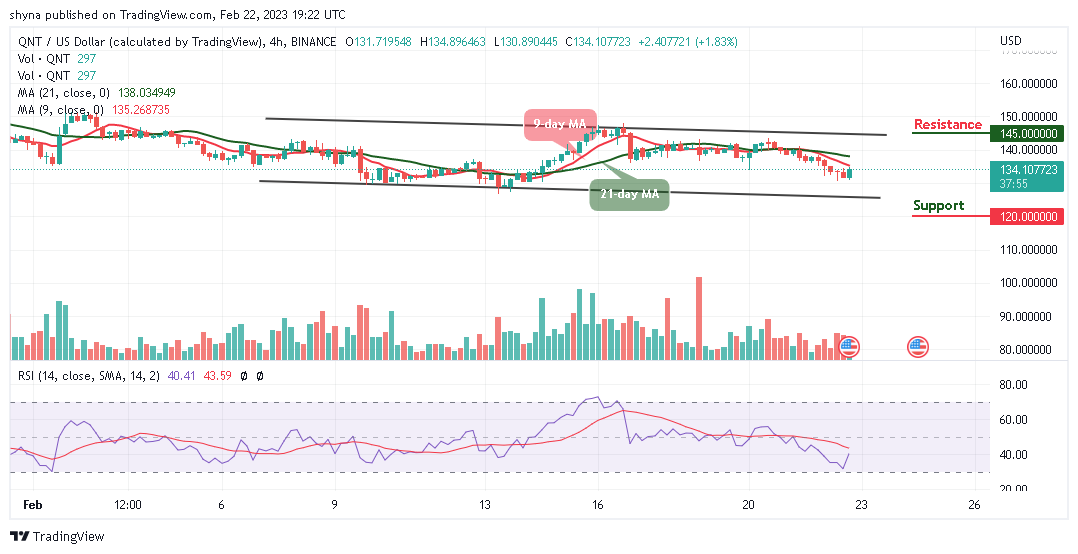
Moreover, if the buyers push the price above the moving averages, it could hit a higher resistance level at $145 and above. At the moment, the technical indicator Relative Strength Index (14) is likely to cross above the 40-level, but if the bulls fail to move the current market value to the upside, bears could bring the coin below the lower boundary of the channel and this could hit the support level at $120 and below.
Place winning Quant trades with us. Get QNT here