0X (ZRXUSD) Support Level Turns Into a Resistance Level
Estimated Reading Time: 2 minutes
Don’t invest unless you’re prepared to lose all the money you invest. This is a high-risk investment and you are unlikely to be protected if something goes wrong. Take 2 minutes to learn more

Free Crypto Signals Channel
ZRXUSD Analysis: Support Level Turns Resistance on ZRX
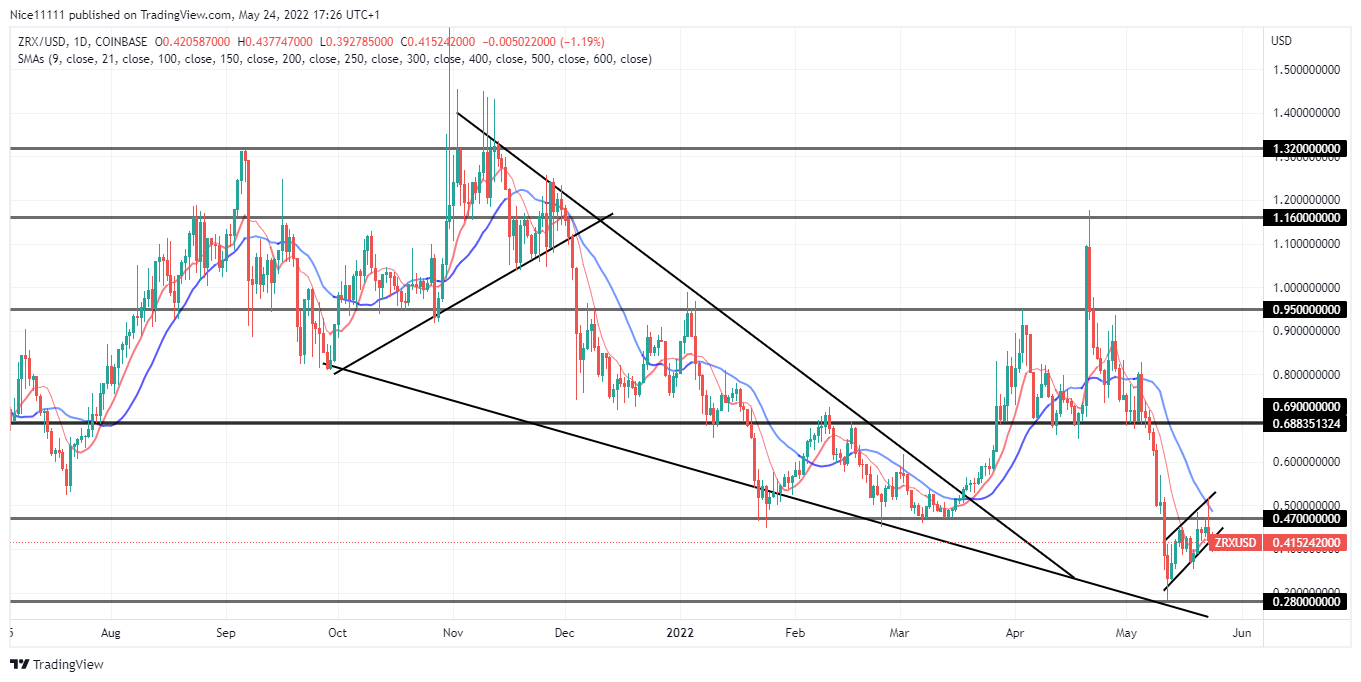
ZRXUSD support level turns to resistance as the market continues to crash. The second half of the previous year faced ultimate resistance at $1.320. The resistance level was tested once in September and twice in November. Shadows formed above the resistance, which revealed the weakness of the bulls. The failed attempt of the bulls caused a false breakout for bulls who anticipated a retest.
ZRXUSD Major Zones
Support level: $0.280, $0.470, $1.160
Resistance Level: $1.320, $0.950, $0.690
There was a structural market shift during mid-November. The market dipped below the $1.160 support level. The market experienced consolidation during the month of December. The previous support levels turned into resistance levels. There was a sell off at $1.160. The market dived past $0.950. A bullish retracement met resistance at $0.950. More sellers flooded the market at the resistance level. This caused the market to dive to $0.4700.
The bulls utilized the confluence of the trend line and the support level to go long. The resistance level at $0.690 failed to hold. The bullish breakout was successful. The resistance level at $0.690 turned to support to further help the bulls push higher. The bulls got exhausted as they tapped into the support level, which had turned into resistance at $1.160. The market formed higher highs and lower lows between $0.950 and $0.690. The market eventually plunged to $0.470.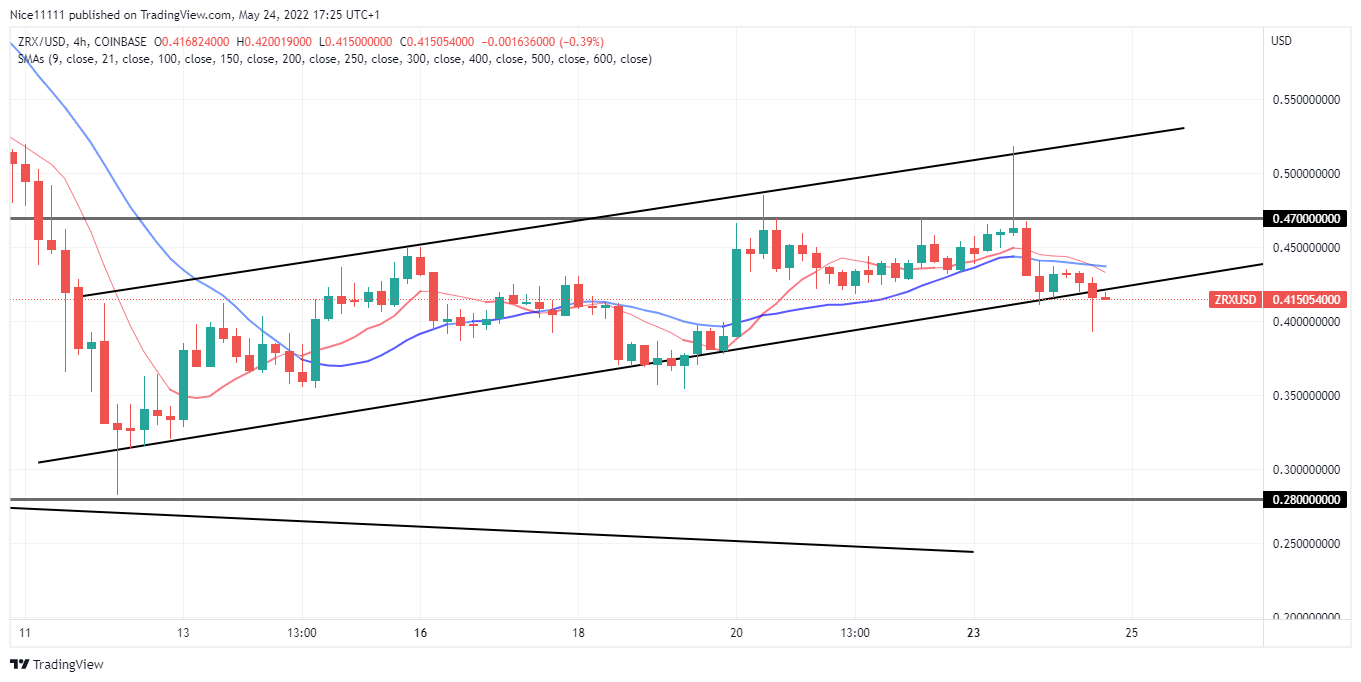
Market Expectations
ZRXUSD support level turns to a resistance level at $0.470. The impulsive move, which was bearish, caused a breakout of $0.470. The bears drove the market to $0.280. The 4 hour chart is very bullish as a result of the correction of the bearish impulse. There is a bearish structural shift on the four-hour chart. The Moving Averages periods 9 and 21 have crossed above the 4 hour candles to signify bearishness. The price is expected to fall to $0.280.
Note: Forexschoolonline.com is not a financial advisor. Do your research before investing your funds in any financial asset or presented product or event. We are not responsible for your investing results.