Chiliz (CHZ/USD) Targets Resistance at $0.035 Amidst Sustained Buying Pressure
Estimated Reading Time: 2 minutes
Don’t invest unless you’re prepared to lose all the money you invest. This is a high-risk investment and you are unlikely to be protected if something goes wrong. Take 2 minutes to learn more
The bull market for Chiliz is advancing gradually, with bulls pushing the price toward the key resistance level at $0.0350. The sustained bullish bias is evident in the series of higher support levels. While this development does not yet represent strong momentum, it signals a progressively bullish sentiment in the market. However, given the subtle nature of this uptrend, the price could face significant bearish pressure at the $0.0350 resistance.
Chiliz (CHZUSD) Market Data
CHZ/USD Price Now: $0.0335
CHZ/USD Market Capitalization: $335.8 million
CHZ/USD Circulating Supply: 10 billion CHZ
CHZ/USD Total Supply: 10 billion CHZ
CHZ/USD CoinMarketCap Ranking: #123
Key Levels to Watch
Resistance: 0.0350, $0.0400, $0.0450
Support: $0.030, $0.025, $0.020
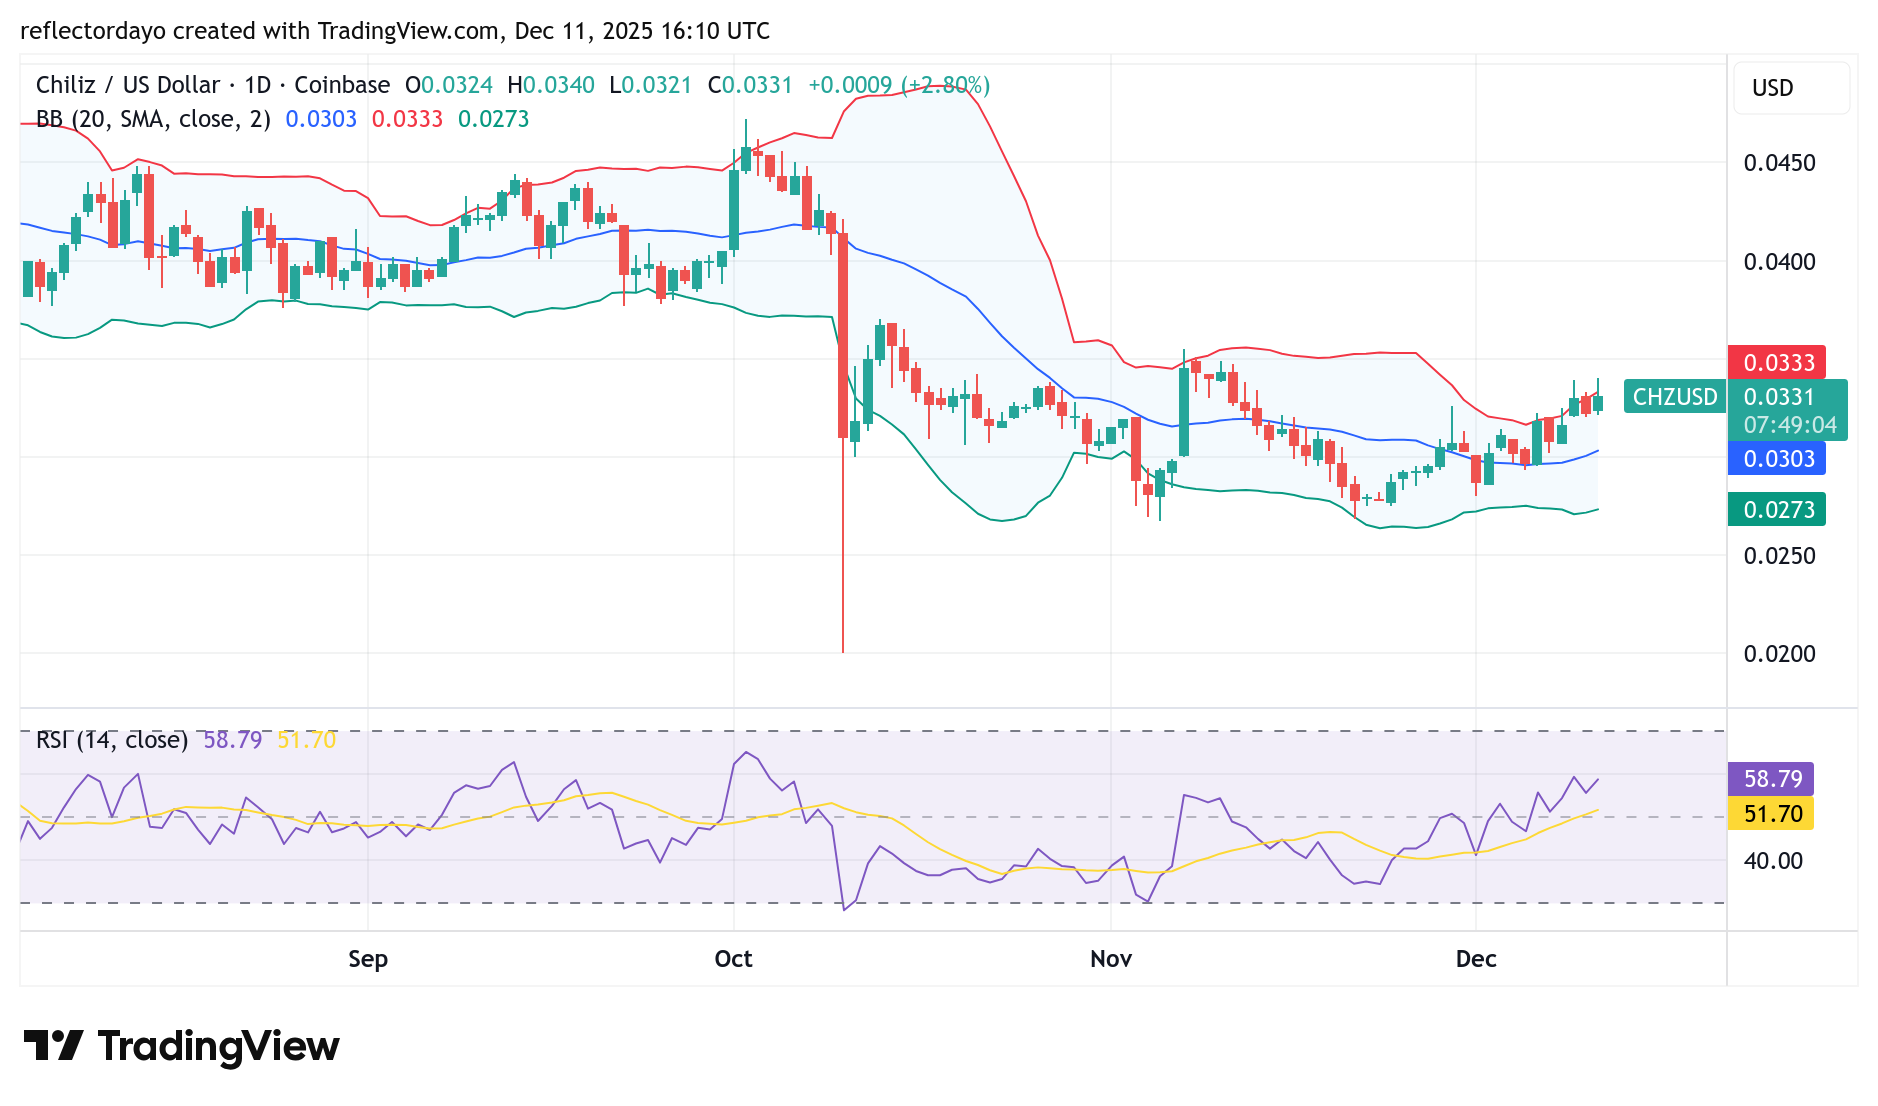
Chiliz (CHZ/USD) Daily Chart Analysis
A mild bullish price action is evident on the Chiliz daily chart; however, it lacks the strength to confirm a clear bullish trend. From a broader perspective, price is consolidating within a channel between the $0.027 and $0.035 levels.
Market attention is now focused on the $0.035 resistance level. A decisive breakout above this point would likely strengthen bullish sentiment. However, substantial sell-side pressure is present at this level. This is visible on the daily chart, where recent candlesticks exhibit pronounced upper shadows, indicating selling interest near this resistance.
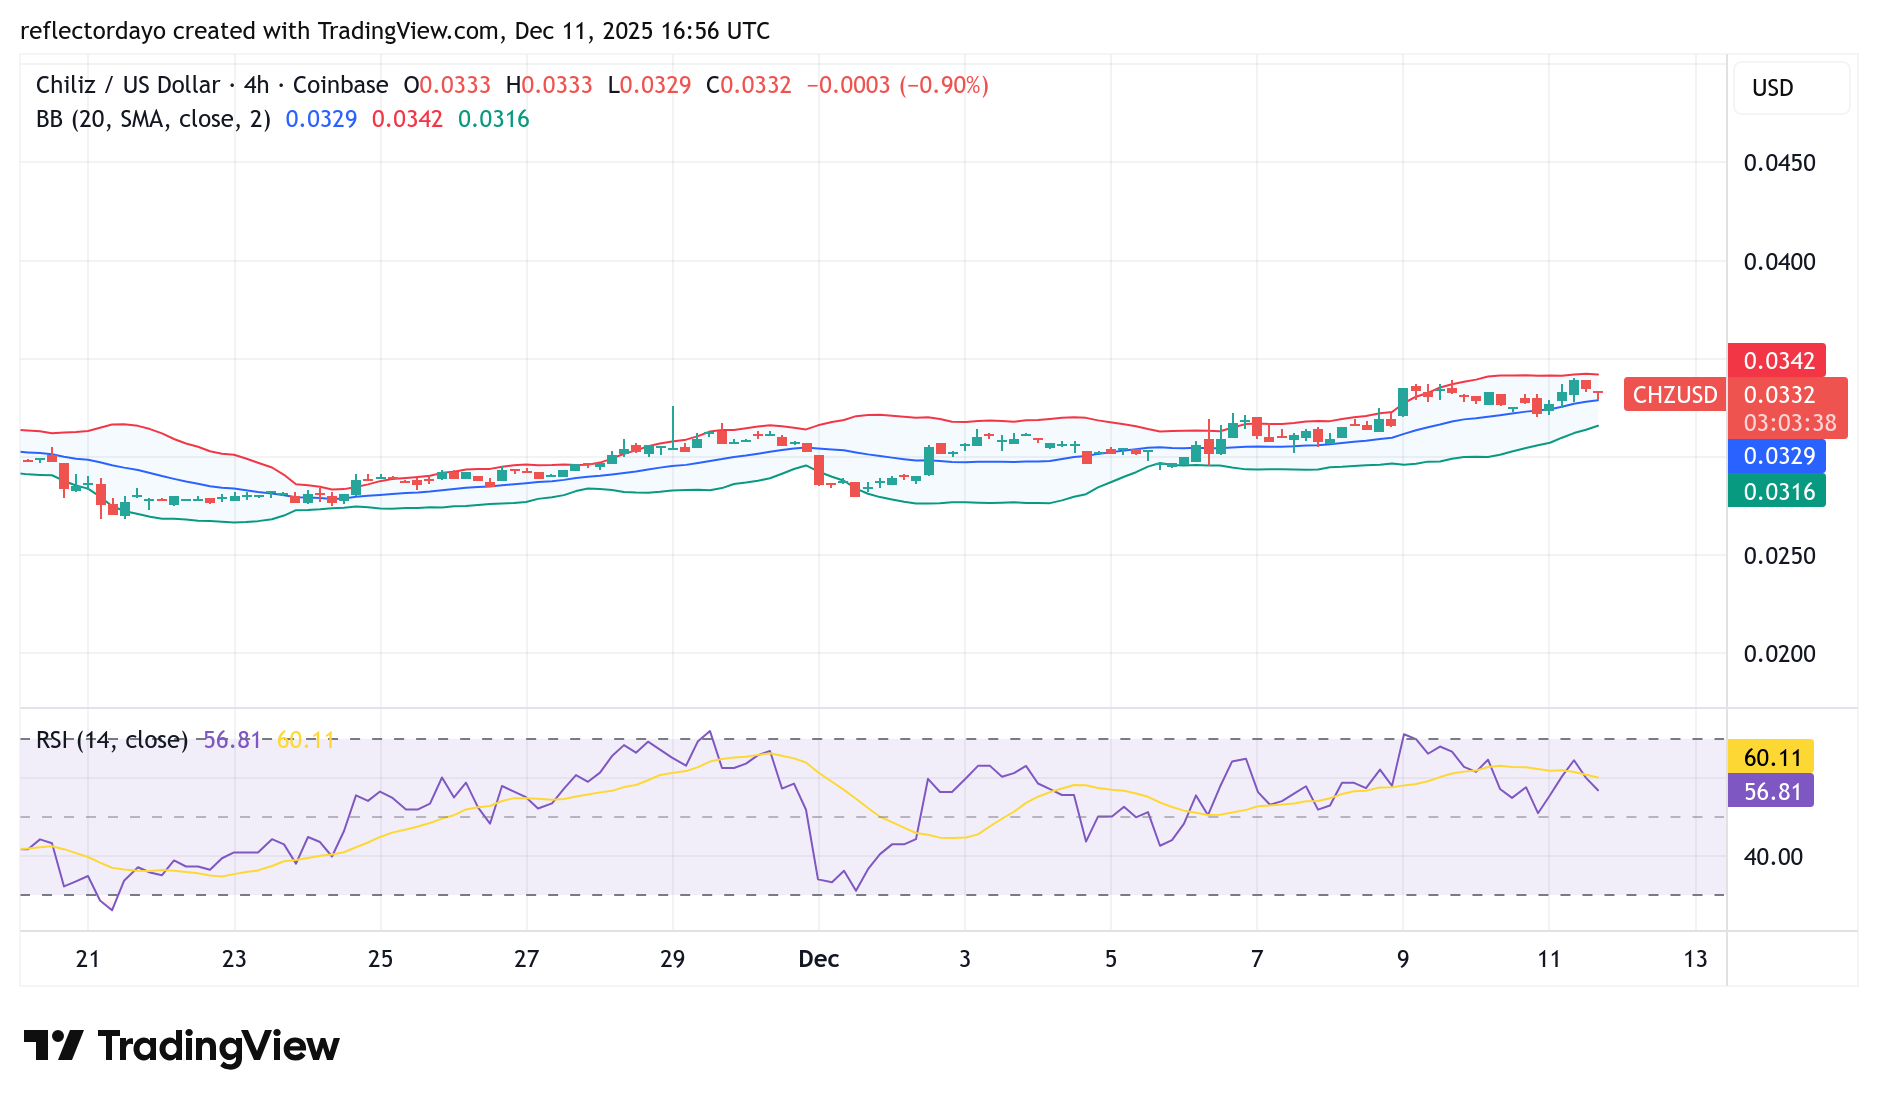
CHZ/USD 4-Hour Chart Outlook
Viewing the market from a lower timeframe perspective—specifically the 4-hour chart—the subtle upward trend is also evident here. We can observe ascending support levels, which confirms that bulls are gradually pushing the market higher. Currently, bulls are trying to maintain support at $0.033. If this level holds, buying pressure will increase toward the bears’ position at $0.0350, potentially forcing a breakout above that key resistance.