Axelar (AXL/USD) Shifts Into an Upward Direction
Estimated Reading Time: 3 minutes
Don’t invest unless you’re prepared to lose all the money you invest. This is a high-risk investment and you are unlikely to be protected if something goes wrong. Take 2 minutes to learn more

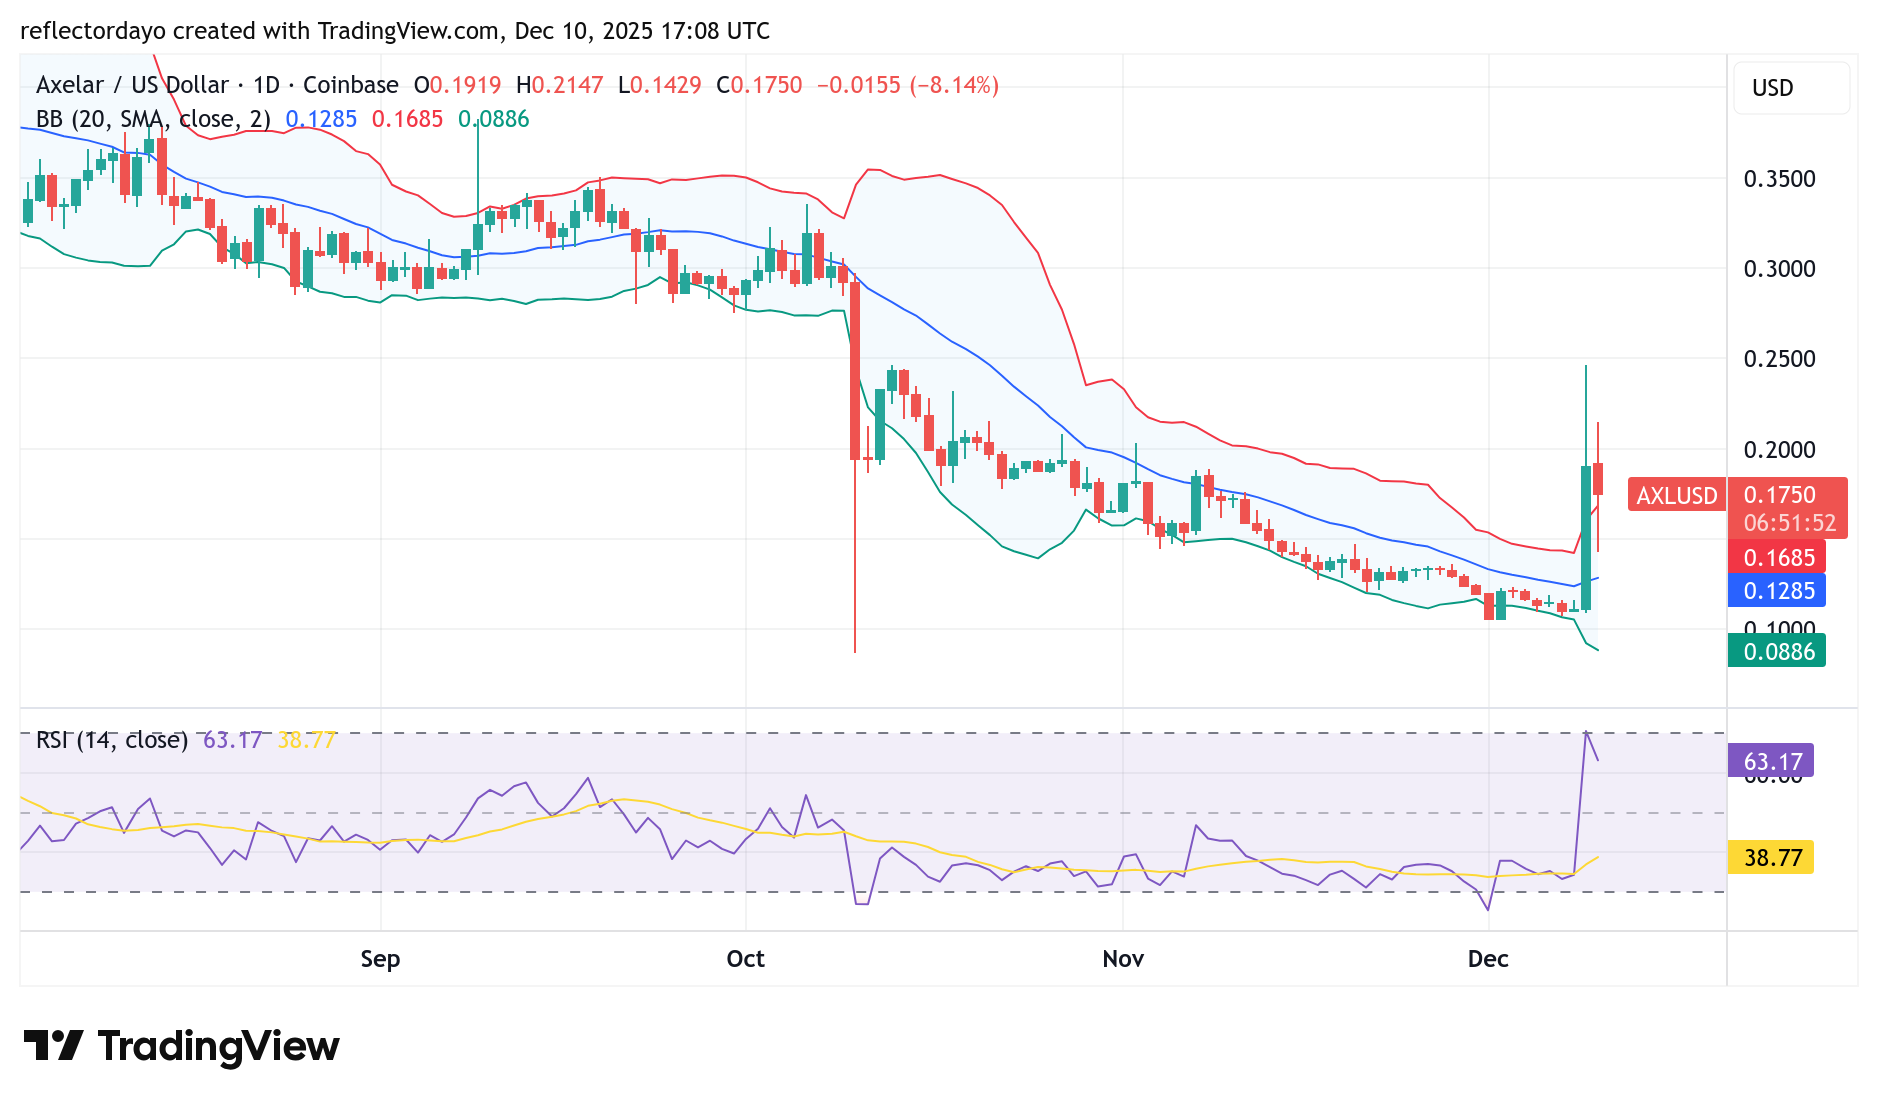
Over the past two trading sessions, the Axelar market has sustained notable upside volatility, signaling a potential end to the prolonged bearish trend that began after the breakdown below the $0.30 price level in October. On the day of that breakdown (October 10), the market established a key support at the $0.10 price level, as indicated by the deep lower shadow of the bearish candlestick.
In recent sessions, price action has consolidated closely around this critical support zone, and this stabilization has now been followed by a strong and meaningful bullish rebound.
Axelar (AXL/USD) Market Data
- AXL/USD Price Now: $0.178
- AXL/USD Market Capitalization: $167 million
- AXL/USD Circulating Supply: 1.08 billion AXL
- AXL/USD Total Supply: 1.22 billion AXL
- AXL/USD CoinMarketCap Ranking: #187
Key Levels to Watch
- Resistance: 0.20, $0.25, $0.30
- Support: $0.12, $0.11, $0.10
Axelar (AXL/USD) Daily Chart Analysis
Following the strong downward volatility observed on October 10, the $0.10 price level emerged as a key support zone. The bearish trend eventually pushed the market back toward this level, where the price then consolidated for several sessions.
Yesterday, the Axelar market recorded a significant bullish breakout, with price surging upward and encountering resistance around the $0.25 level. After this sharp move, the market has now stabilized slightly below the $0.20 mark.
If the crypto signal continues to hold above this region, it signals that bullish sentiment is gradually strengthening, potentially paving the way for further upward movement.
Today’s trading session shows heightened volatility, as reflected by candlesticks with pronounced upper and lower shadows—evidence of strong competition between buyers and sellers. Despite this, the market is currently stabilizing around the $0.177 price area. This could mark the early formation of a new support level, especially if bulls shift their focus toward reclaiming and breaking above the $0.20 resistance zone.
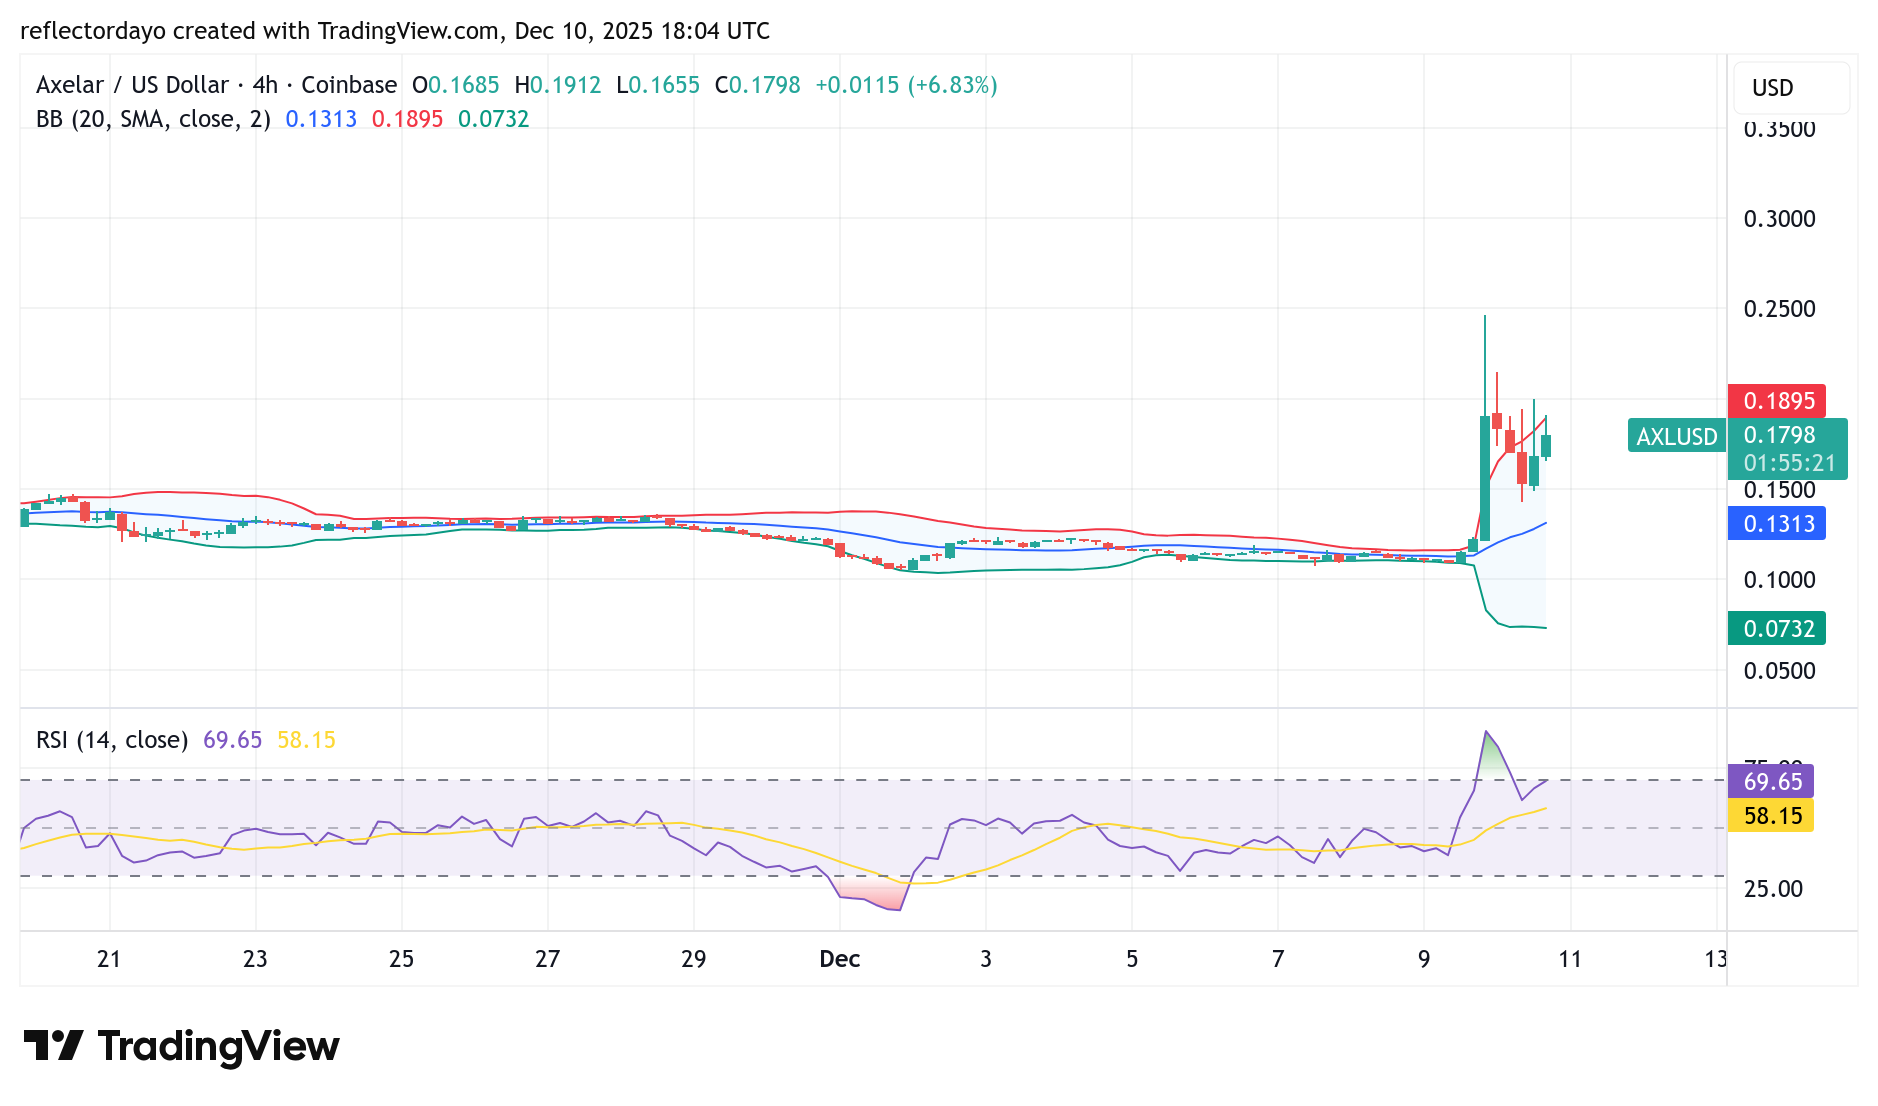
AXL/USD 4-Hour Chart Outlook
From the lower time-frame perspective, the price action shows that a support base has been established around the $0.15 level. Bulls have attempted to initiate a rebound toward the $0.20 resistance area, but the repeated upper wicks on the candlesticks indicate persistent bearish pressure near $0.20.
In the ongoing trading session, a shooting star candlestick has formed, reflecting strong bearish presence at this resistance zone. If both the $0.15 support and the $0.20 resistance continue to hold, the market is likely to consolidate within this range for a while before making its next significant move.