Cartesi (CTSI/USD) Bulls Attempt to Regain Control Around $0.034
Estimated Reading Time: 3 minutes
Don’t invest unless you’re prepared to lose all the money you invest. This is a high-risk investment and you are unlikely to be protected if something goes wrong. Take 2 minutes to learn more

The Cartesi market continues to exhibit a broader downward trend. After losing the critical support at the $0.07 price level in October, bearish momentum intensified. During that breakdown, the price briefly tested the $0.02–$0.03 zone, marking one of the sharpest declines in recent months.
As the bearish trend progressed, the $0.04 level emerged as a temporary but notable support zone, where the market consolidated for a while. However, in December, price action slipped below this key level once again, signaling a renewed advantage for the bears.
Despite this weakness, bullish traders are now attempting to stabilize the market around the $0.034 area. Whether this level can serve as a strong enough base for a recovery remains to be seen, but for now, the bias still tilts in favor of sellers.
Cartesi (CTSI/USD) Market Data
- CTSI/USD Price Now: $0.0386
- CTSI/USD Market Capitalization: $34.5 million
- CTSI/USD Circulating Supply: 889.9 billion CTSI
- CTSI/USD Total Supply: 1 billion CTSI
- CTSI/USD CoinMarketCap Ranking: #555
Key Levels to Watch
- Resistance: 0.045, $0.050, $0.06
- Support: $0.035, $0.030, $0.025
Cartesi (CTSI/USD) Daily Chart Analysis
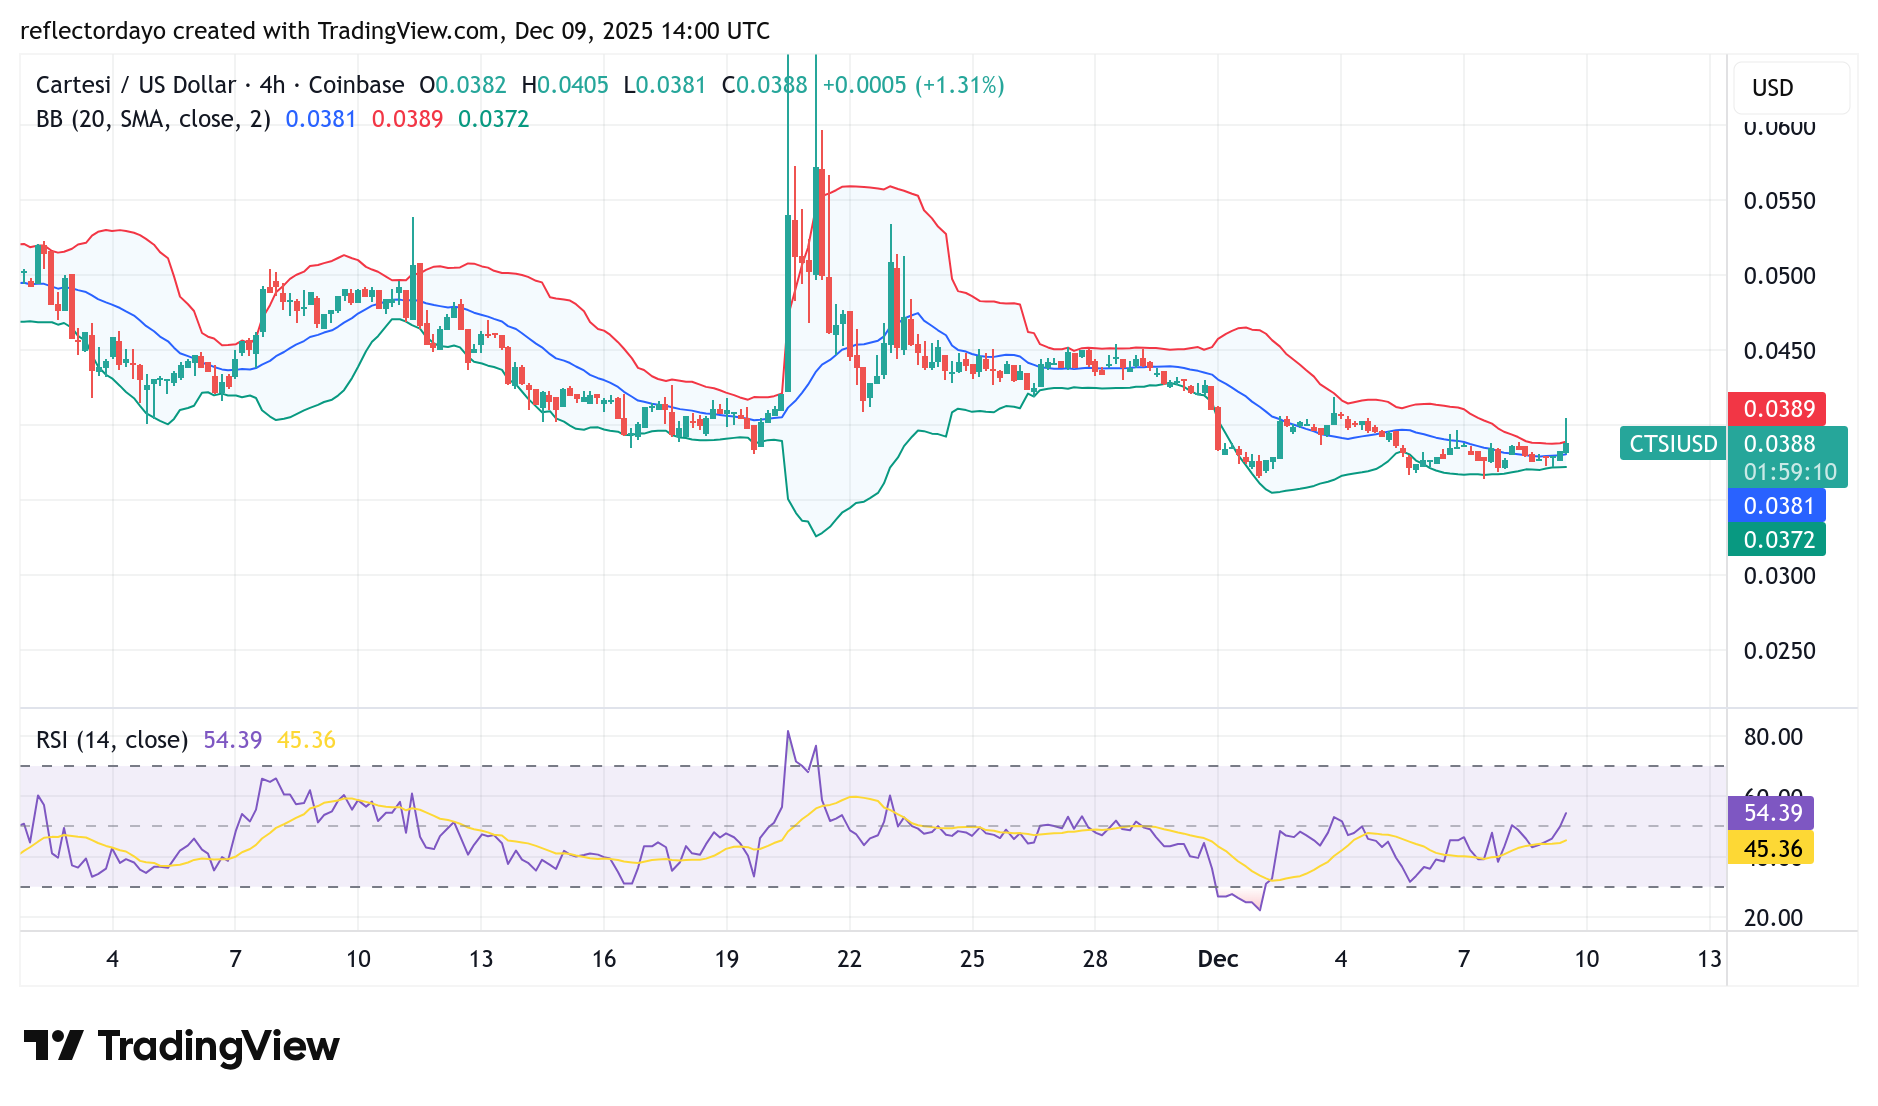
With the newly established support shifting to the $0.0367 price level, bulls are still showing signs of resilience, especially as this support remains close to the key $0.04 zone. In today’s trading session, the Cartesi market recorded a strong bullish rebound, pushing price action upward toward the $0.04 level—a zone currently dominated by bearish sentiment. However, once the price reached this area, it faced rejection and pulled back to its current trading region.
Considering the broader market structure, the likelihood of bulls reclaiming the $0.04 level appears limited. The overall trend has remained bearish since September–October, and momentum continues to favor the downside. The market may be positioning itself to revisit the $0.02 zone, which was last tested in October. If price fails to hold above the $0.035 region, a decline toward the $0.02 support becomes increasingly probable.
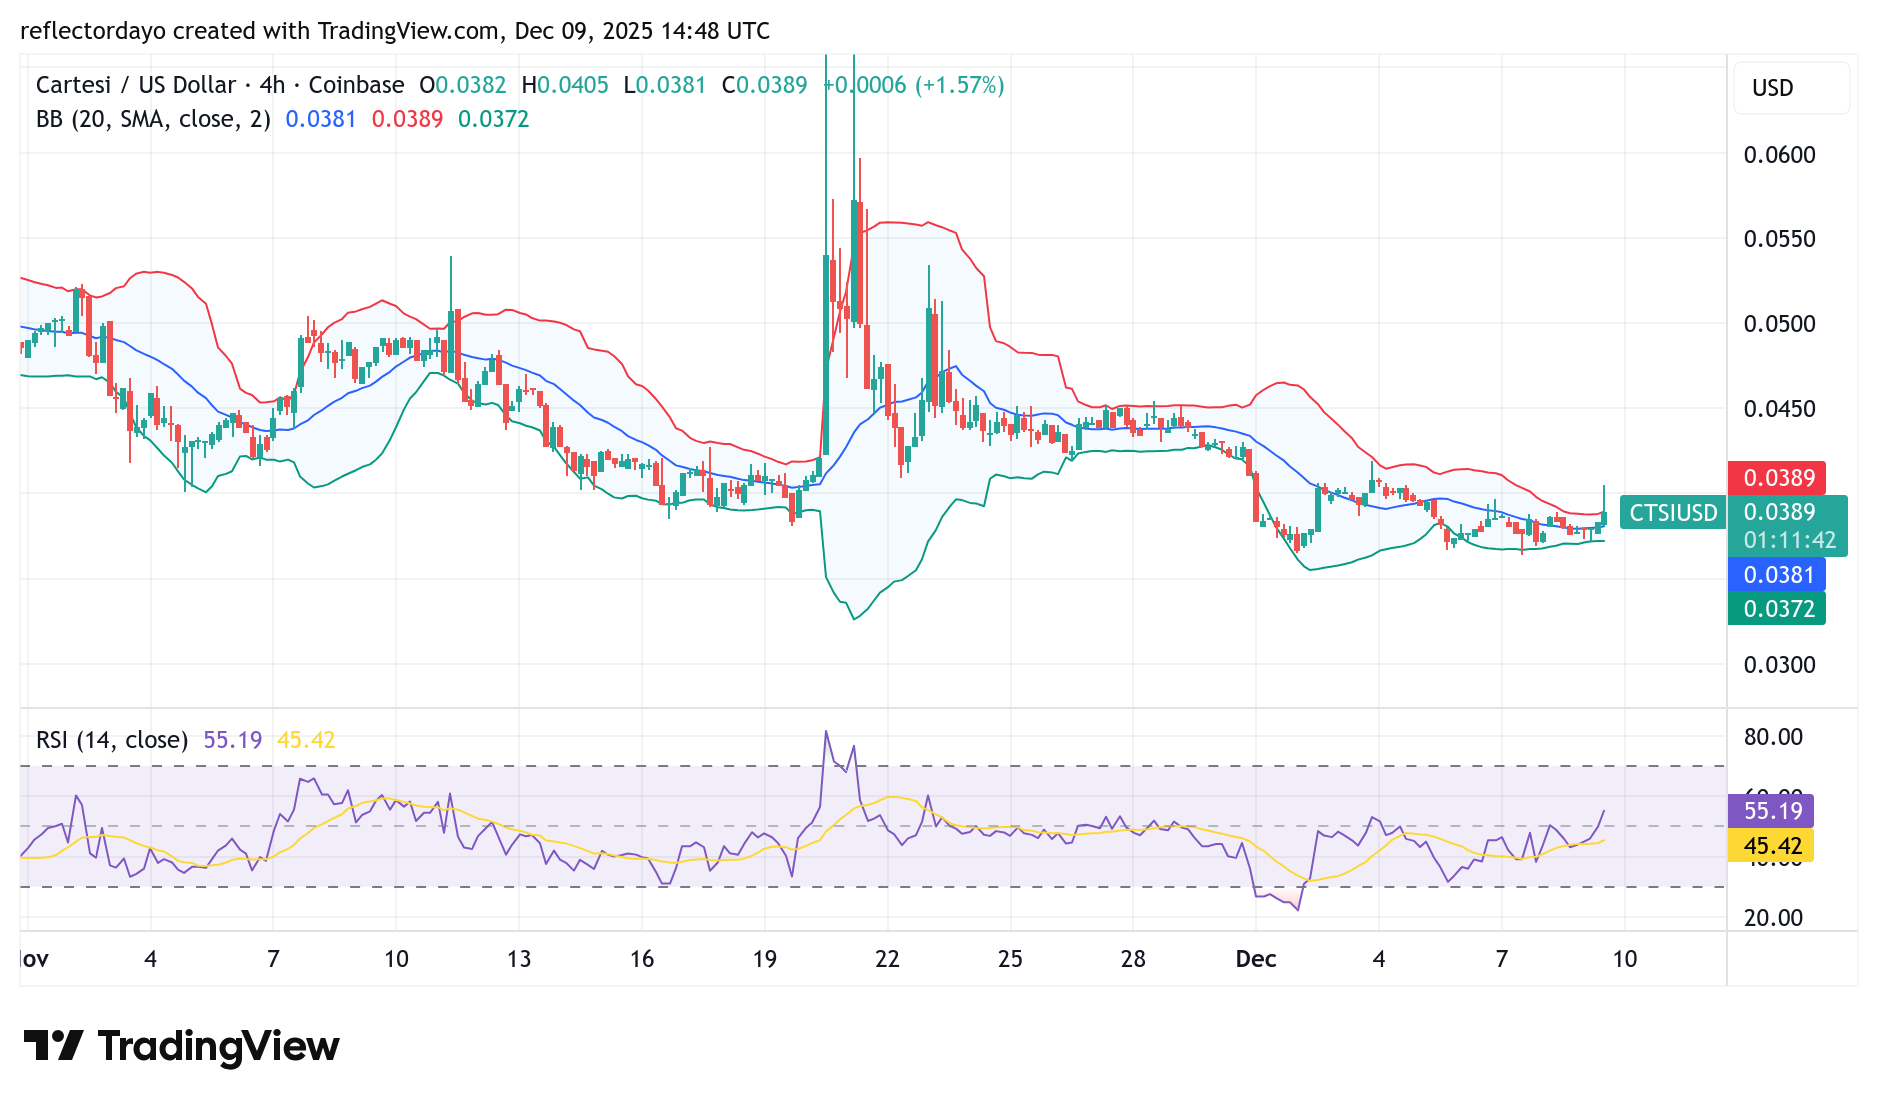
CTSI/USD 4-Hour Chart Outlook
Zooming into the 4-hour timeframe, the latest candlestick shows a strong upper shadow, signaling significant bearish pressure at the price level currently controlled by sellers. This upper wick reflects how price initially surged during the ongoing session but was quickly rejected once it reached this key resistance zone. For now, from a short-term perspective, the $0.04 level remains a firm and active resistance area.