Orca Market (ORCA/USD) May Be Building Strength to Break Above $1.40
Estimated Reading Time: 3 minutes
Don’t invest unless you’re prepared to lose all the money you invest. This is a high-risk investment and you are unlikely to be protected if something goes wrong. Take 2 minutes to learn more
The ORCA market appears to be building the momentum needed to break—and sustain—a move above the key $1.40 price level. A successful breakout and steady hold above this critical threshold would serve as a strong indication of a potential market shift to the upside.
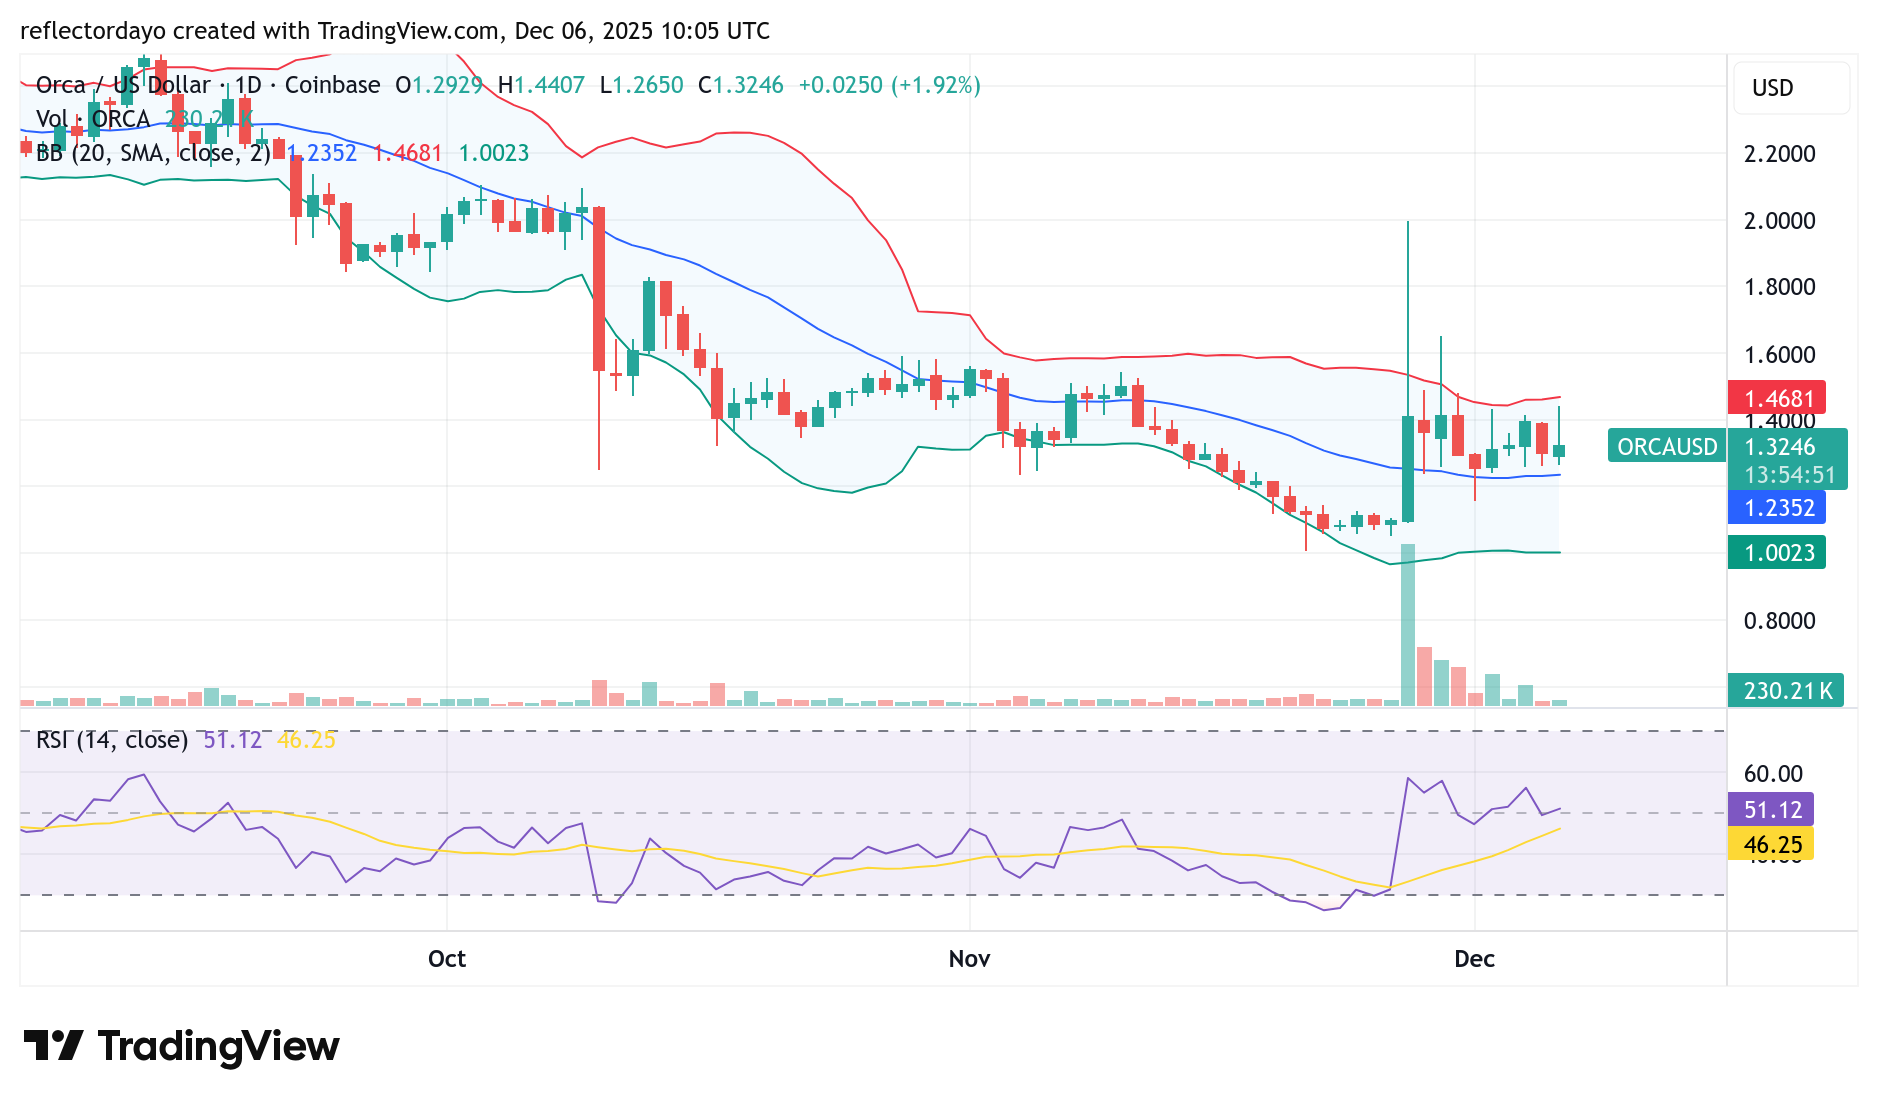
From the daily chart, we observe that ORCA had been in a sustained downtrend. However, toward the end of November, bullish momentum began to emerge following a notable halt in the bearish drive near the $1.00 support level. This renewed strength suggests that buyers may gradually be regaining control, setting the stage for a possible upward continuation if the $1.40 resistance is cleared decisively.
ORCA/USD) Market Data
- ORCA/USD Price Now: $1.32
- ORCA/USD Market Capitalization: $79 million
- ORCA/USD Circulating Supply: 60.2 million ORCA
- ORCA/USD Total Supply: 75 million ORCA
- ORCA/USD CoinMarketCap Ranking: #328
Key Levels to Watch
- Resistance: $1.40, $1.50, $1.60
- Support: $1.20, $1.10, $1.00
Orca Market (ORCA/USD) Daily Chart Analysis
After the market found support near the $1.00 level—a zone that likely marked the end of the previous bearish run—we observed a gradual shift in sentiment. Between late November and early December, the support level ascended from around $1.08 to approximately $1.20. Since then, bulls have consistently defended this zone, while repeated attempts to push above the $1.40 resistance have been rejected.
This behavior has kept the Orca market confined within a consolidation channel between $1.20 and $1.40. As both demand and supply hold their respective positions, volatility continues to decline. This is reflected in the descending histogram on the trading volume indicator, suggesting reduced market participation.
Based on current crypto signals, the consolidation phase may persist, as bears continue to show strength around the $1.40 resistance. Notably, today’s trading session has so far formed a shooting star candlestick, indicating strong selling pressure at the top of the range. At the same time, bulls remain committed to defending the $1.20 support, creating a balanced yet indecisive market structure.
ORCA/USD 4-Hour Chart Outlook
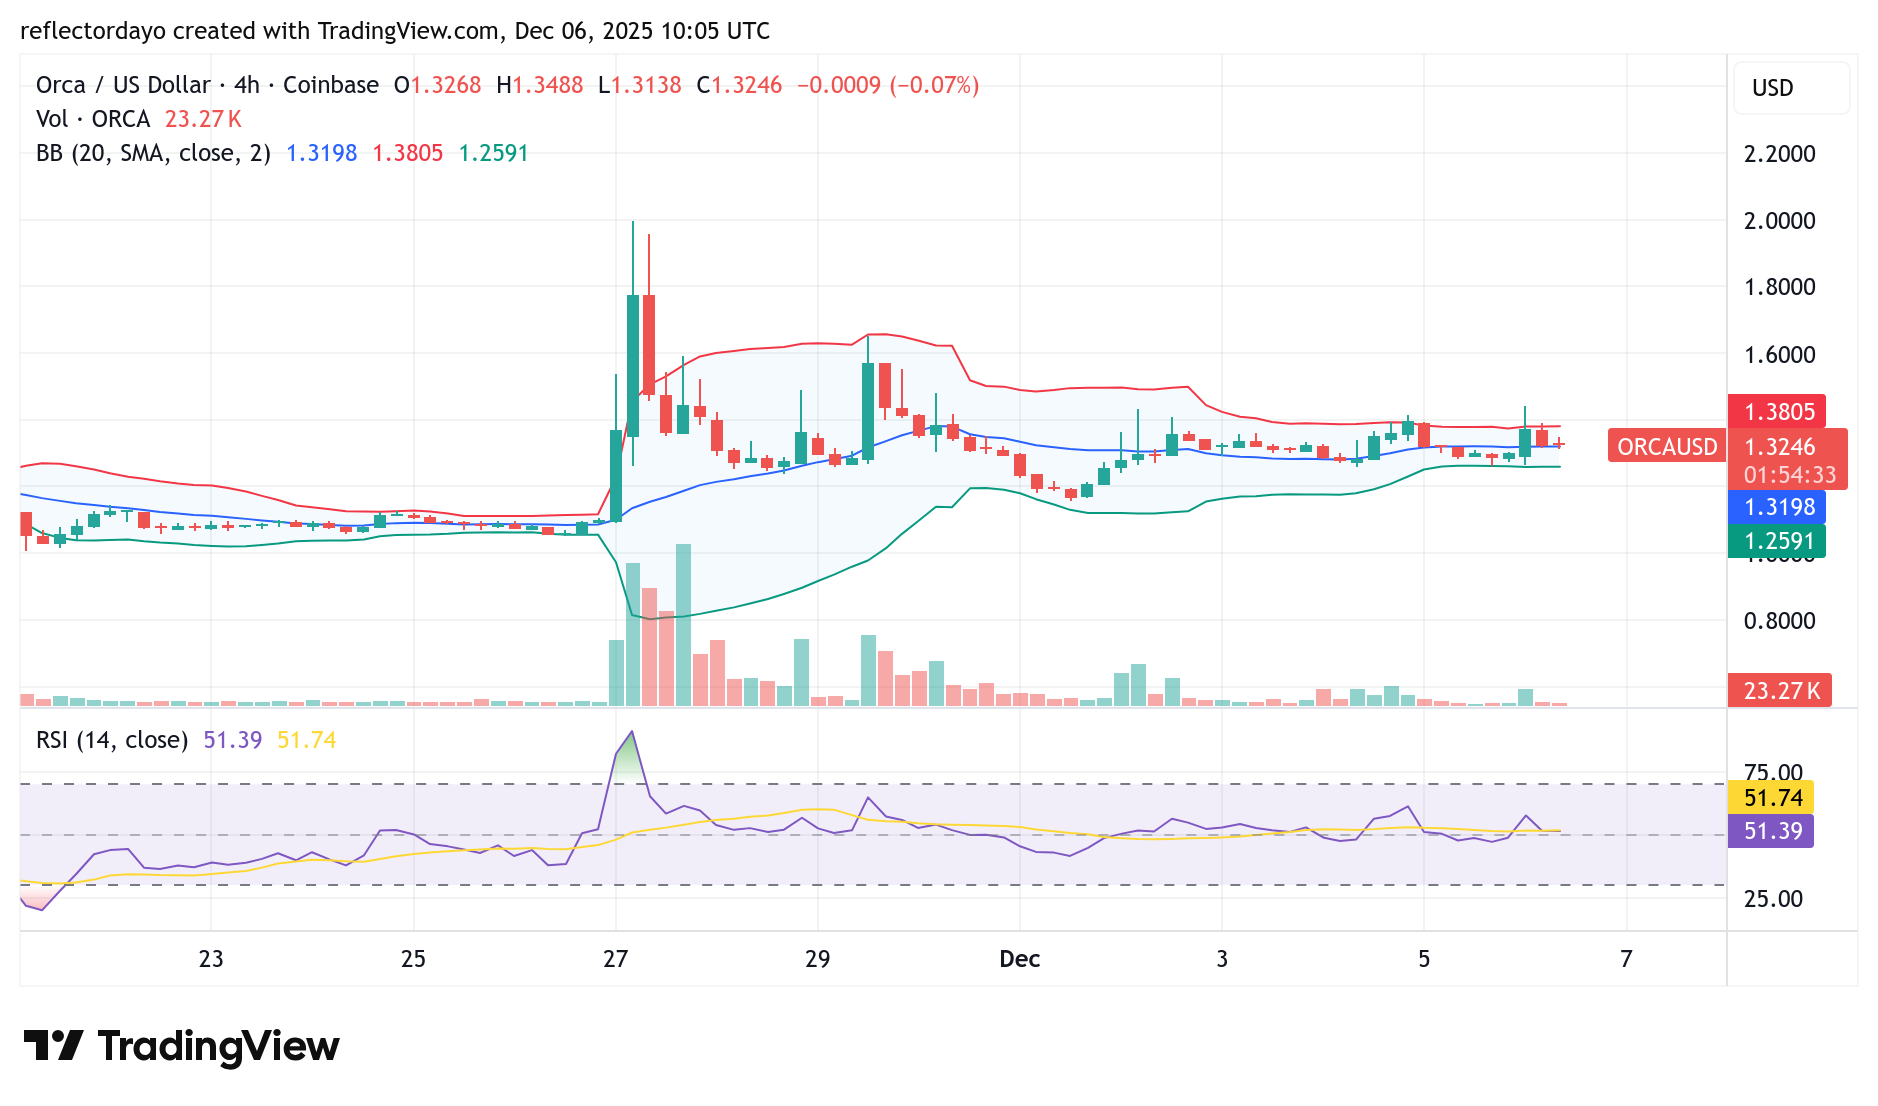
Zooming into the smaller 4-hour timeframe, the market appears to be well-settled within a consolidation channel. Both the demand and supply zones remain intact, supported by steady bullish and bearish sentiment, respectively. The indicators also reflect this equilibrium, showing a balanced momentum with no clear directional bias.
Given the current structure, consolidation may persist within this zone. However, one key point is already evident: the market has firmly reversed from the $1.00 price level, establishing it as a significant turning point for the ongoing trend.