POL (prev. MATIC) Price Prediction: POL/USDT Maintains Form as It Surges
Estimated Reading Time: 2 minutes
Don’t invest unless you’re prepared to lose all the money you invest. This is a high-risk investment and you are unlikely to be protected if something goes wrong. Take 2 minutes to learn more
Date: August 9, 2025
The POL (previously MATIC) token has experienced continued buying activity, fueling a significant market comeback as price action advances toward the $0.3000 mark. How long can this trend last? Let’s find out below.
POL/USDT Long-Term Trend—Bullish (Daily Chart)
Key Price Levels:
Resistance: $0.2750, $0.3000, $0.3250
Support: $0.2500, $0.2250, $0.2000
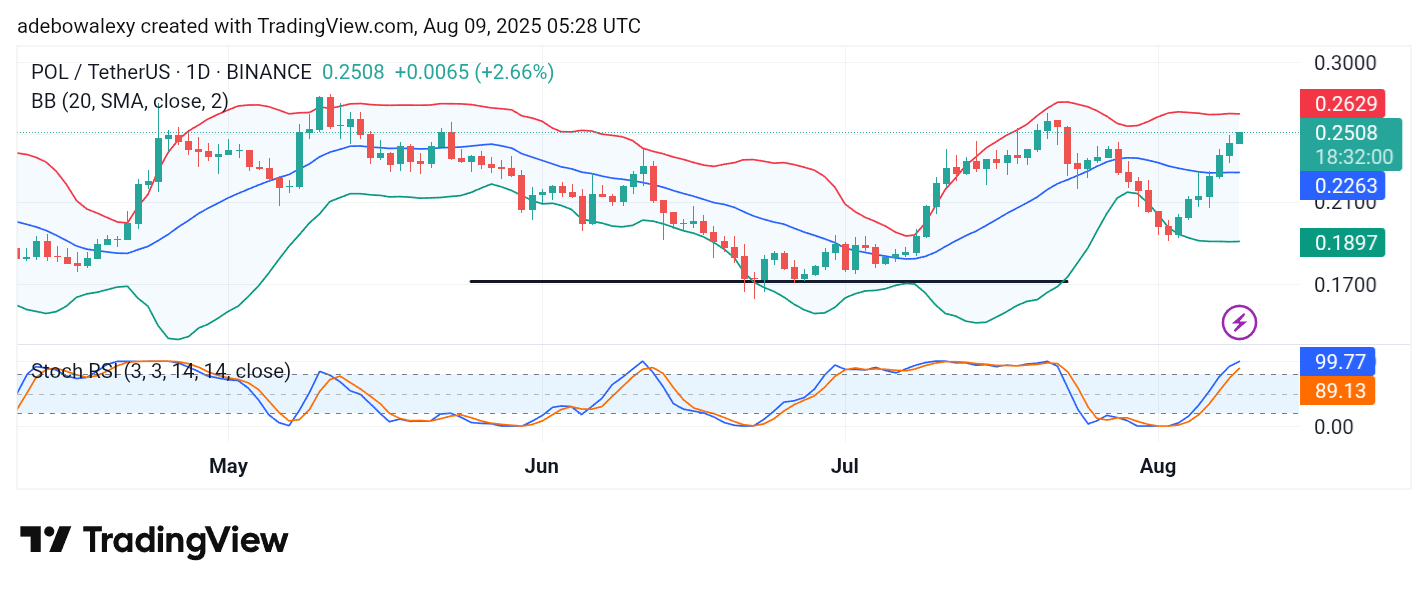
The POL (previously MATIC) market has witnessed a notable rebound over the past week. Even now, the latest price candle on the daily chart remains green. Trading activity is positioned above the middle band of the Bollinger Bands (BB) indicator, with the bands showing widely diverged extremes—signaling strong volatility. The lines of the Stochastic Relative Strength Index (SRSI) have maintained their upward trajectory, lingering in the overbought region.
POL/USDT Price Prediction: POL (prev. MATIC) Upside Stays Strong
Recent price candles indicate that the POL token continues to attract strong buying interest. This steady upward movement has persisted for several days, supported by bullish trading indicators.
The BB indicator remains well widened as price action trends higher. Meanwhile, the SRSI maintains a generally upward path, though its lead line is beginning to slow and turn slightly sideways in the overbought zone. Despite this, bullish sentiment remains dominant in the market.
POL/USDT Price Prediction: POL (prev. MATIC) Bullish Activity Persists (4-Hour Chart)
On the POL (prev. MATIC) 4-hour chart, it is evident that buying momentum remains consistent. Price action follows a steady upward path, with the BB indicator also trending higher. Currently, price action is situated near the upper band of the BB indicator.
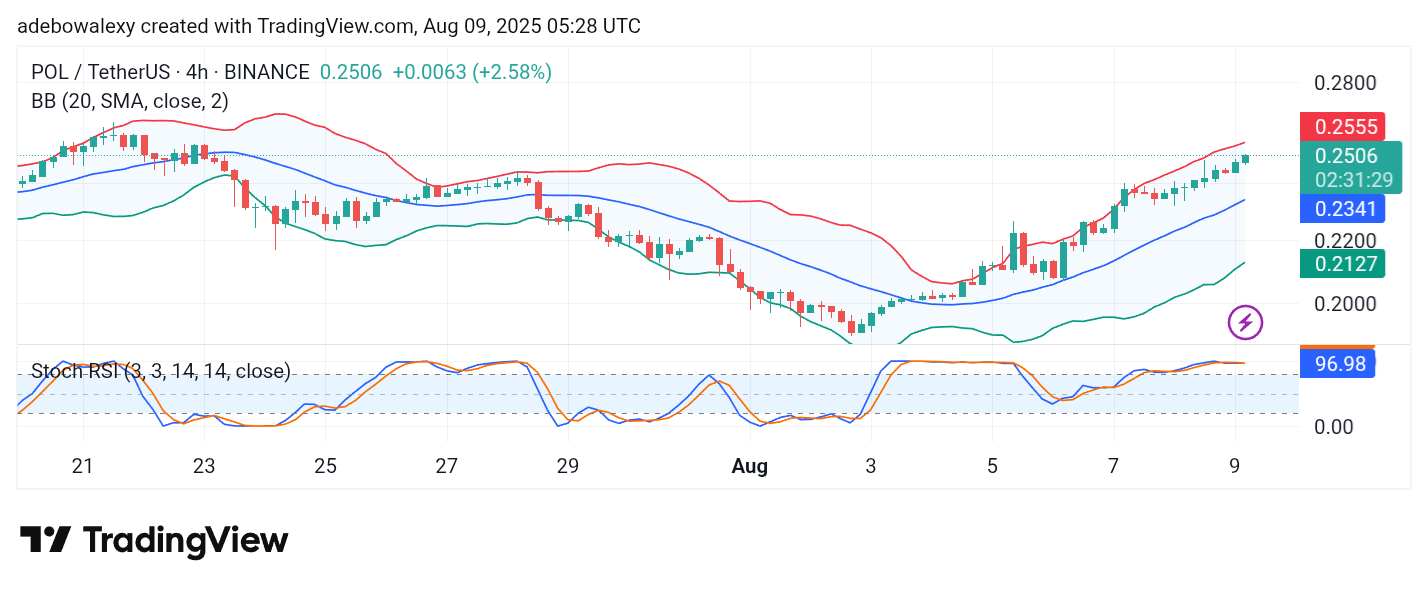
Even in the latest session, the last candle remains green, reflecting sustained buying pressure. The SRSI lines are merged in the overbought region but continue moving sideways without reaching the 100 level. Nonetheless, price action maintains an upward course toward the $0.3000 mark.