POL (prev. MATIC) Price Prediction: POL/USDT Bulls Oppose Further Price Declines
Estimated Reading Time: 3 minutes
Don’t invest unless you’re prepared to lose all the money you invest. This is a high-risk investment and you are unlikely to be protected if something goes wrong. Take 2 minutes to learn more

Date: August 2, 2025
While the POL (prev. MATIC) market on the 24-hour chart had been in continuous decline over several sessions, the ongoing session shows signs of resistance to deeper price drops. Although this bullish move appears subdued, it may hold. If sustained, more upward movement could follow. Currently, the price stands below the lower band of the Bollinger Bands (BB) indicator.
POL/USDT Long-Term Trend — Bullish (Daily Chart)
Key Price Levels:
Resistance: $0.2500, $0.3000, $0.5035
Support: $0.1900, $0.1750, $0.1500
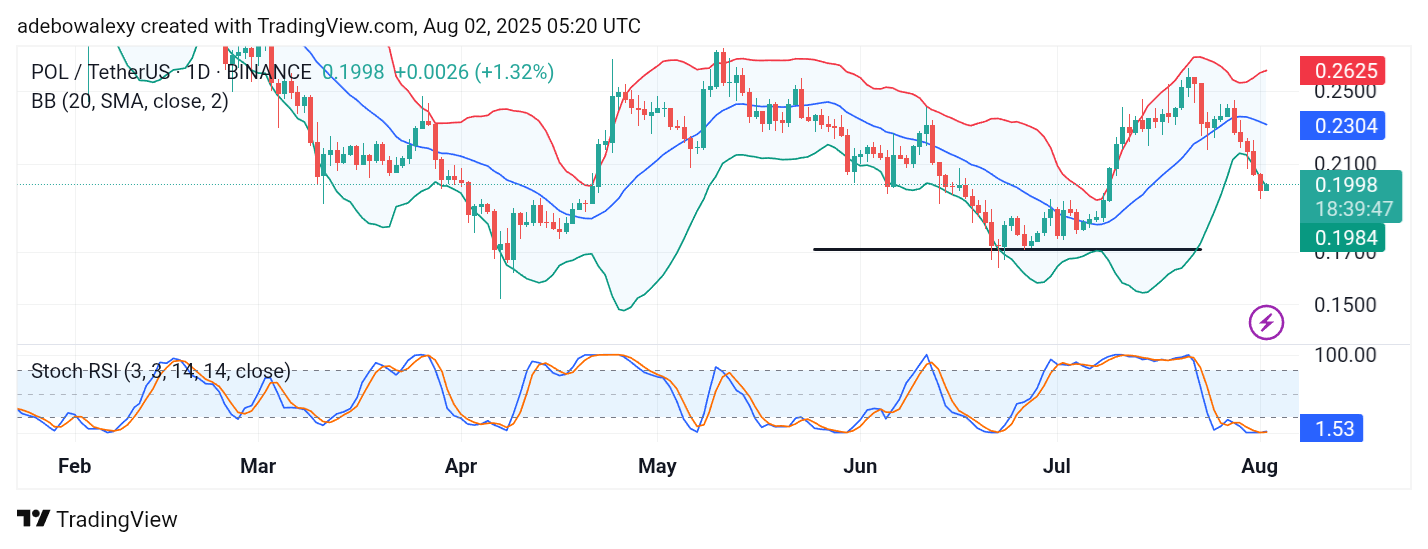
The current session in the POL (prev. MATIC) market is showing bullish behavior. The corresponding price candle appears green and has emerged at the tail end of a strong downward retracement. As a result, the latest price candle is situated below the lower band of the BB indicator.
Recent candles have consistently hugged the lower band, indicating persistent bearish pressure. Meanwhile, the Stochastic Relative Strength Index (SRSI) has reached the bottom of the oversold region. However, a bullish crossover is now visible at the terminal end of the SRSI, hinting at a potential reversal.
POL/USDT Price Prediction: Upside Correction Looks Weak
Despite the appearance of an upward rebound in the POL market, the move still appears relatively weak. Recent price activity has significantly extended the lower band of the BB indicator, and the latest price candle remains below that level.
Likewise, the SRSI crossover is occurring deep in the oversold region, suggesting that more bullish activity is required to confirm a meaningful trend reversal. Therefore, the market still appears predisposed to further price declines unless stronger bullish momentum emerges.
POL/USDT Price Prediction: Minimal Gains Persist (4-Hour Chart)
On the 4-hour chart, the POL (prev. MATIC) market shows that although price action is still pressing against the lower band of the BB indicator, an upward retracement remains underway. This marks the second consecutive session in which bulls are attempting to regain control.
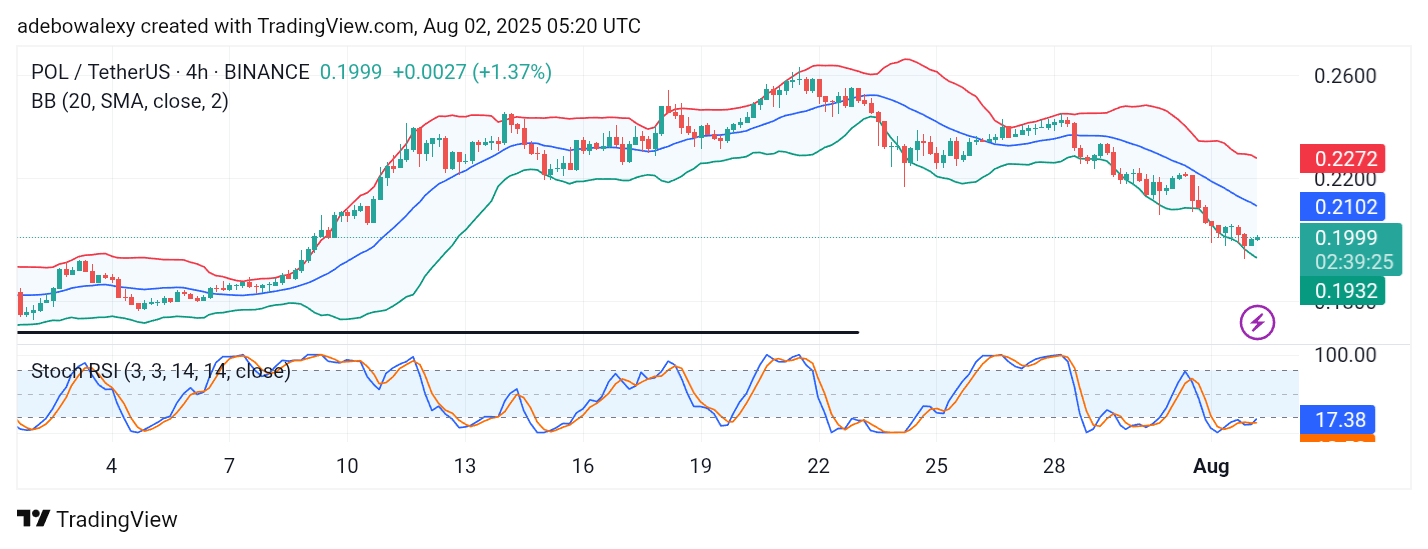
However, price action continues to trade below the BB midline, and the SRSI lines remain below the 20 mark—deep in the oversold territory. Technically, this reflects continued market vulnerability. As such, traders should watch for a potential barrier around the $0.2100 price level.