POL (prev. MATIC) Price Prediction: POL/USDT Prepares to Regain Traction
Estimated Reading Time: 3 minutes
Don’t invest unless you’re prepared to lose all the money you invest. This is a high-risk investment and you are unlikely to be protected if something goes wrong. Take 2 minutes to learn more

Date: July 26, 2025
The POL (formerly MATIC) token has shown a notable recovery over the past two weeks. However, this week has seen a slight pullback in price action. Despite this, the market appears to be making a concerted effort toward a renewed upward recovery.
POL (prev. MATIC) Price Prediction: POL/USDT Long-Term Trend — Bullish (Daily Chart)
Key Price Levels:
Resistance: $0.2500, $0.3000, $0.5035
Support: $0.2000, $0.1750, $0.1500
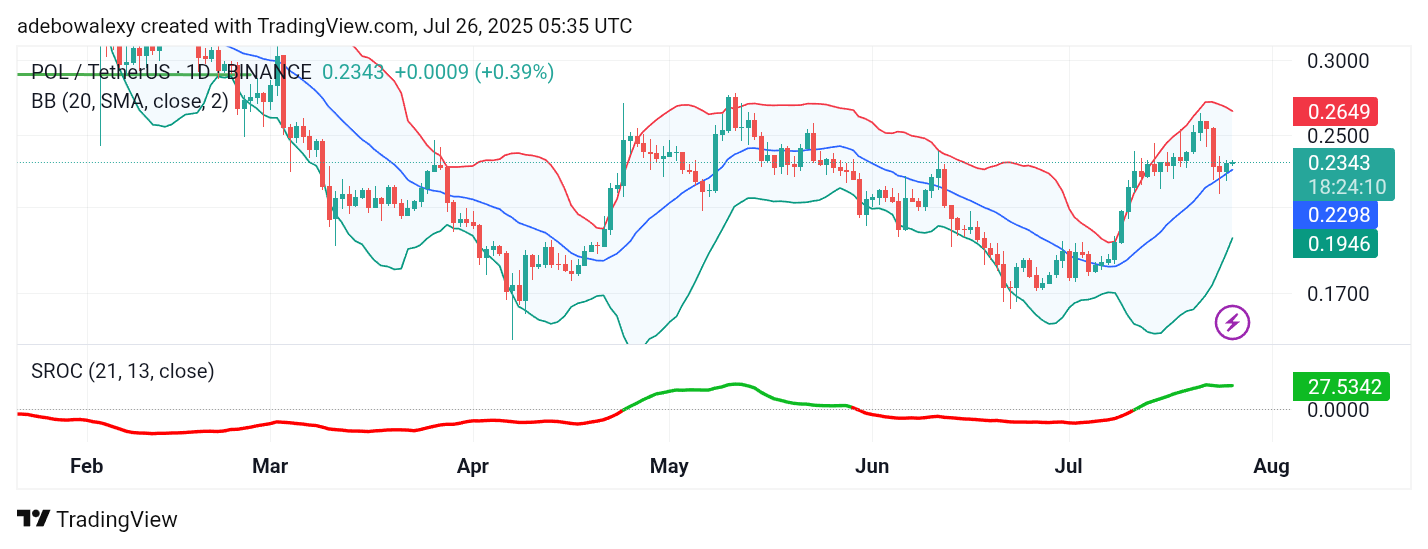
On the daily chart, price action for POL (prev. MATIC) currently stands just above the middle band of the Bollinger Bands (BB) indicator. The last two candlesticks are green, with the latest one floating above the midline of the BB. The BB indicator itself is also trending upward, though it is beginning to contract—an indication of potential volatility compression before a breakout.
Additionally, the Smoothed Rate of Change (SROC) indicator line remains above the equilibrium level, albeit moving sideways at the moment. This suggests a pause in momentum but still leans in favor of bullish sentiment.
POL (prev. MATIC) Price Prediction: POL/USDT Maintains a Promising Foundation
As observed, the POL (prev. MATIC) price action remains above the midline of the BB indicator on the daily chart—an encouraging sign that bullish momentum is still in play. The BB indicator’s contracting upper and lower bands further suggest a buildup in price tension, which may precede a breakout. The SROC indicator also holds above the equilibrium level, reinforcing the view that bullish forces are still active in the market.
POL (prev. MATIC) Price Prediction: POL/USDT Maintains Bullish Consistency (4-Hour Chart)
Even on the 4-hour chart, POL/USDT maintains an upward trajectory. Although the last candlestick is relatively small, it is positioned slightly above the BB midline, aligning with the bullish structure seen on the daily chart.
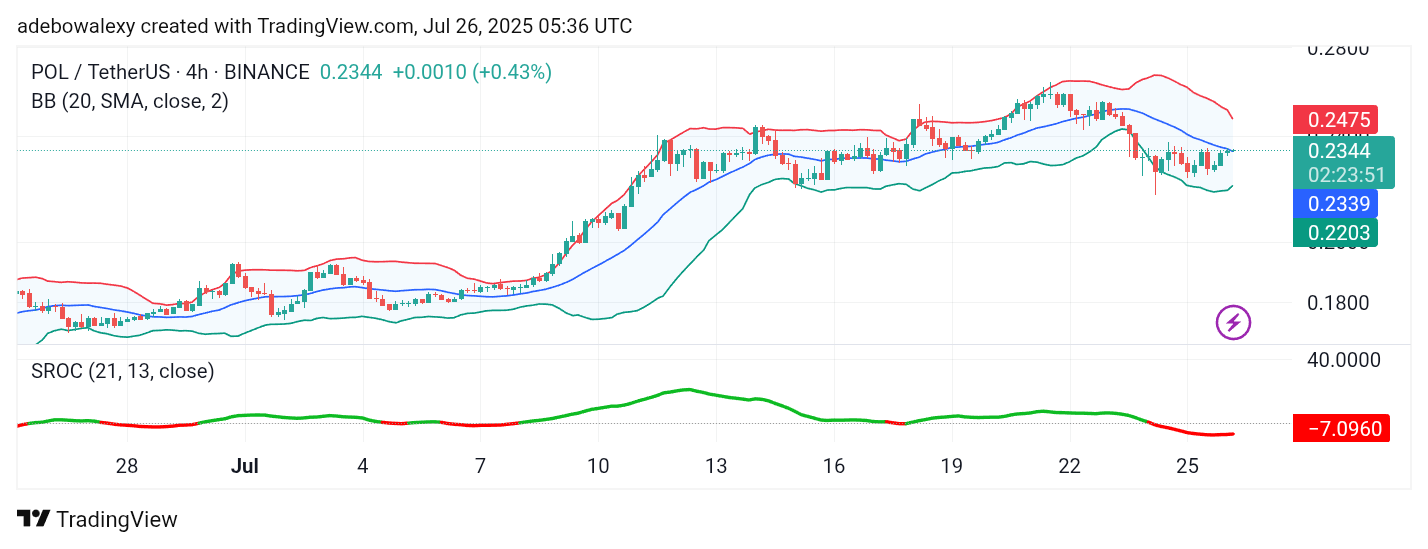
Furthermore, the upper and lower bands of the BB indicator are converging, indicating reduced volatility and potential for a breakout. The SROC indicator, although currently below the equilibrium line, is trending sideways with a slight upward inclination. This hints at a possible shift toward renewed bullish momentum.
Given these technical signals, the market appears poised to challenge the $0.2500 resistance level. A successful breach could see the token establishing support above this price point, further strengthening its recovery outlook.