Solana (SOL) Price Prediction: SOL/USDT Price Action Deflects Downward
Estimated Reading Time: 2 minutes
Don’t invest unless you’re prepared to lose all the money you invest. This is a high-risk investment and you are unlikely to be protected if something goes wrong. Take 2 minutes to learn more

Date: July 18, 2025
As anticipated, the Solana market has just breached the $180 resistance level. Despite this, price activity still lacks vigor and appears poised to record more gains. Let’s examine the likelihood of this occurring.
Solana (SOL) Price Prediction: SOL/USDT Long-Term Trend—Bullish (Daily Chart)
Key Price Levels
Resistance: $190.00, $200.00, $210.00
Support: $175.00, $165.00, $155.00
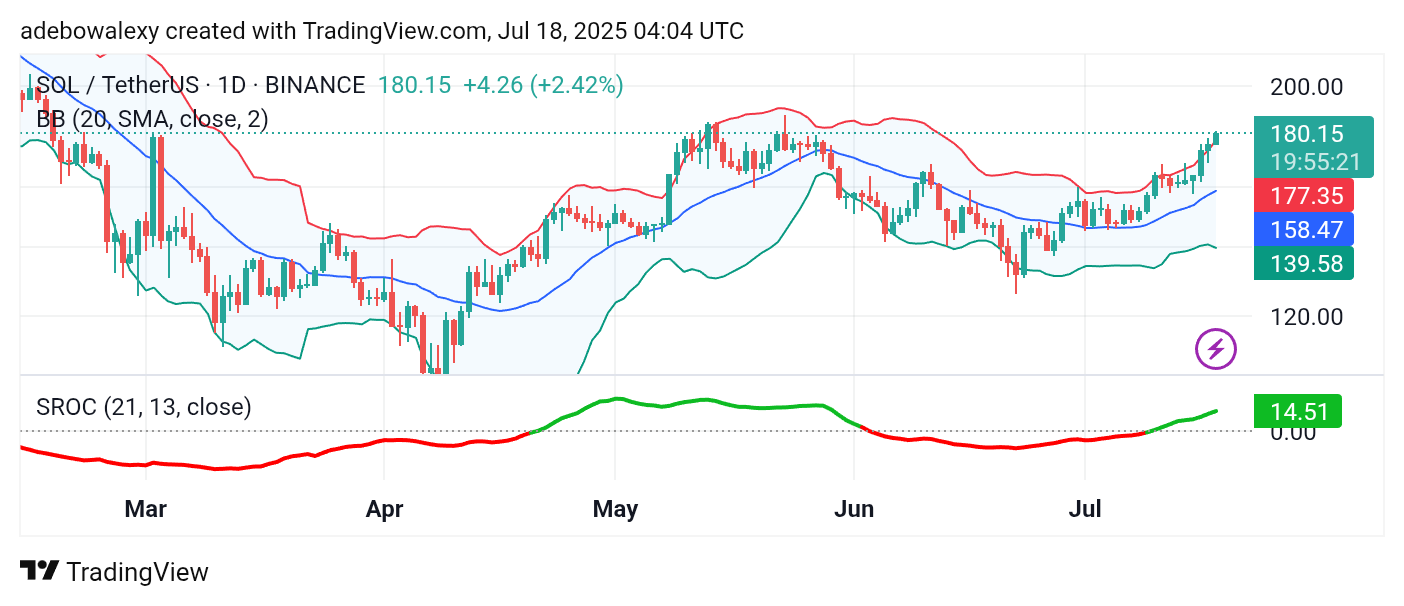
Price activity on the Solana daily chart has maintained a bullish trajectory. With strong bullish momentum, it has breached the uppermost limit of the Bollinger Bands (BB). The latest price candle stands green above the upper band of the BB indicator. Likewise, the Smoothed Rate of Change (SROC) indicator line continues to curve steadily upward, having risen past the equilibrium level at 14.51 at the time of writing.
SOL/USDT Appears Ready for More Upside
It was widely anticipated that the Solana market would rise above the $180 price level. Currently, the market is trading above that threshold. Price behavior suggests that bullish momentum remains strong.
The applied BB indicator has expanded, yet it still struggles to contain price action on the daily chart. The latest green candle indicates that prices may rise further. Likewise, the SROC line continues to ascend above the equilibrium level, affirming that bullish pressure remains healthy in this market.
Solana (SOL) Price Prediction: SOL/USDT Faces Minimal Rejection but Stays Afloat (4-Hour Chart)
Price action on the Solana 4-hour chart remains largely bullish and above the $180 price level, though a minor pullback has occurred from the upper limit of the BB indicator. The most recent price candle is red.
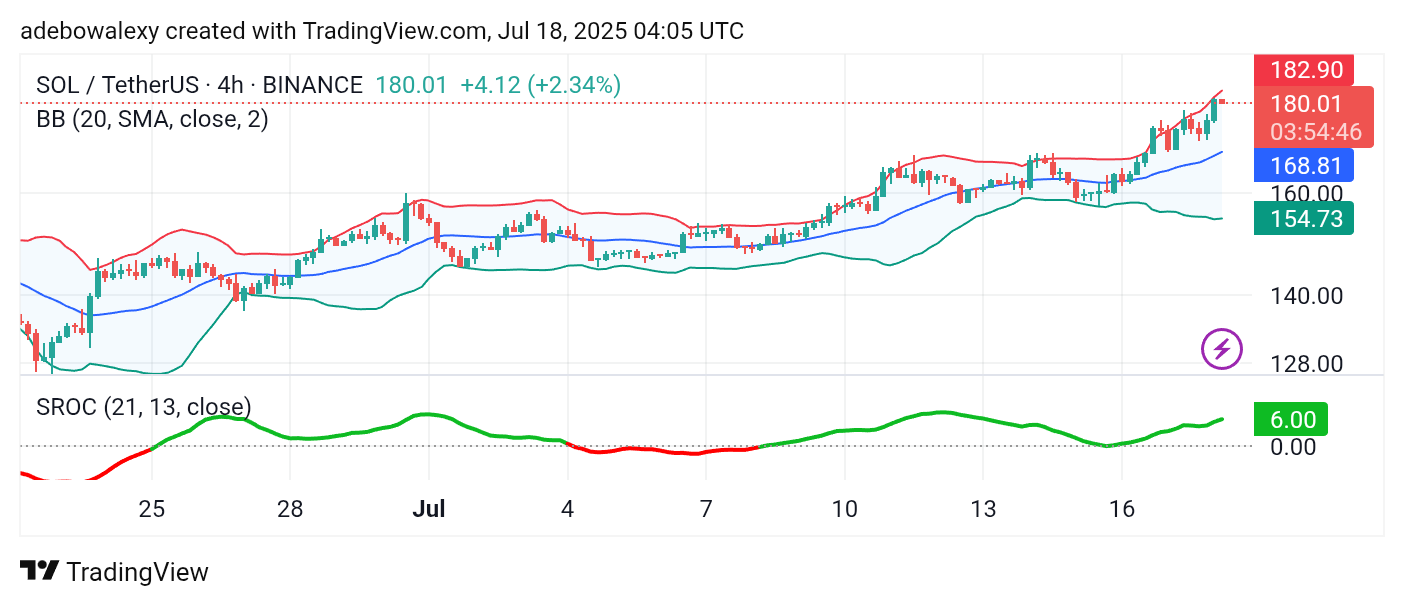
Nevertheless, price activity continues to hover near the upper limit of the BB indicator. Similarly, the SROC line maintains its upward trajectory above the equilibrium level. Technically, this indicates that price action may continue higher, potentially moving toward the $190 resistance level.