Uniswap (UNI) Price Prediction: UNI/USDT Price Action Deflects Downward
Estimated Reading Time: 3 minutes
Don’t invest unless you’re prepared to lose all the money you invest. This is a high-risk investment and you are unlikely to be protected if something goes wrong. Take 2 minutes to learn more
Date: July 17, 2025
Uniswap has been in a medium-term upward correction. However, the token recently experienced a modest pullback from a technical resistance level. Despite this, the market remains generally positioned to continue along its upward trajectory.
Uniswap (UNI) Price Prediction: UNI/USDT Long-Term Trend—Bullish (Daily Chart)
Key Price Levels
Resistance: $9.00, $10.00, $11.00
Support: $8.00, $7.00, $6.00
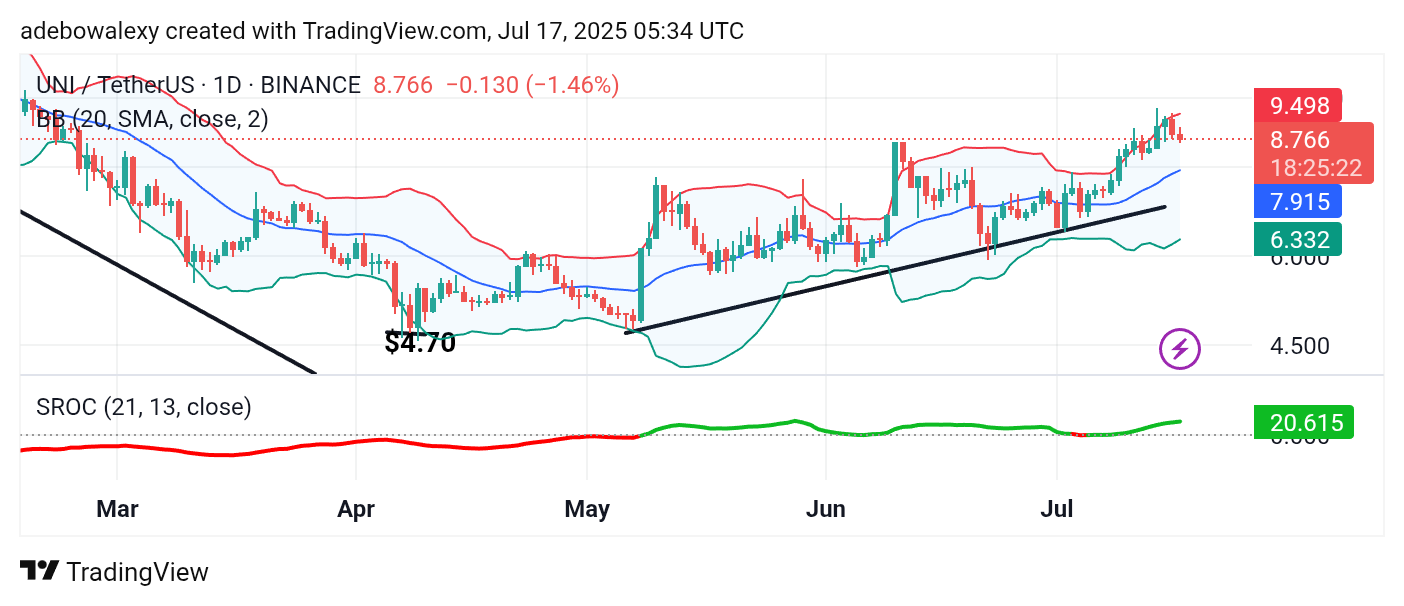
Since the previous session, price action on the daily chart has rebounded downward from resistance formed at the upper limit of the Bollinger Bands (BB) indicator. Similarly, the current session is represented by a red price candle.
Nevertheless, price activity remains above the middle band of the BB indicator, which itself continues to project upward. In addition, the Smoothed Rate of Change (SROC) indicator line remains above the equilibrium level, maintaining a slight upward slope.
Uniswap (UNI) Price Prediction: UNI/USDT Sees a Modest Rejection
Uniswap has performed well recently, showing a notable upward retracement in price. The token continues to trade well above the $8.00 mark. However, price action has now moved lower for the second consecutive session.
Given that price action remains above the middle band of the BB indicator, the recent retracement appears to have minimal impact on the broader upward trend. The SROC indicator line also remains above the equilibrium level and holds a slight upward trajectory, despite the pullback. Consequently, upside momentum still appears favored in this market.
Uniswap (UNI) Price Prediction: UNI/USDT May Be Starting an Upward Rebound (4-Hour Chart)
On the 4-hour chart, price action has touched the lower band of the BB indicator. However, the latest price candle is a green one, albeit small in comparison to previous candles.
Currently, price action remains below the BB midpoint, though the overall direction of the BB indicator continues to tilt upward. Meanwhile, the SROC indicator line is oscillating sideways above the equilibrium level.
Technically, these conditions suggest that bulls may still have an opportunity to regain control, potentially driving price action toward the $9.50 resistance level.