Bitcoin (BTC) Price Prediction: BTC/USDT Seeks Support Above the $123,000 Threshold
Estimated Reading Time: 3 minutes
Don’t invest unless you’re prepared to lose all the money you invest. This is a high-risk investment and you are unlikely to be protected if something goes wrong. Take 2 minutes to learn more

Date: July 16, 2025
Recently, Bitcoin surpassed the $123,000 price level, establishing a new all-time high. However, as expected, headwinds from sellers and broader economic developments weakened the bullish momentum, leading to a rejection in the market. Nonetheless, the market managed to sustain above the $116,000 level and has now begun retracing toward previously reached highs.
Bitcoin (BTC) Price Prediction: BTC/USDT Long-Term Trend — Bullish (Daily Chart)
Key Price Levels
Resistance: $120,000, $122,000, $124,000
Support: $118,000, $116,000, $114,000
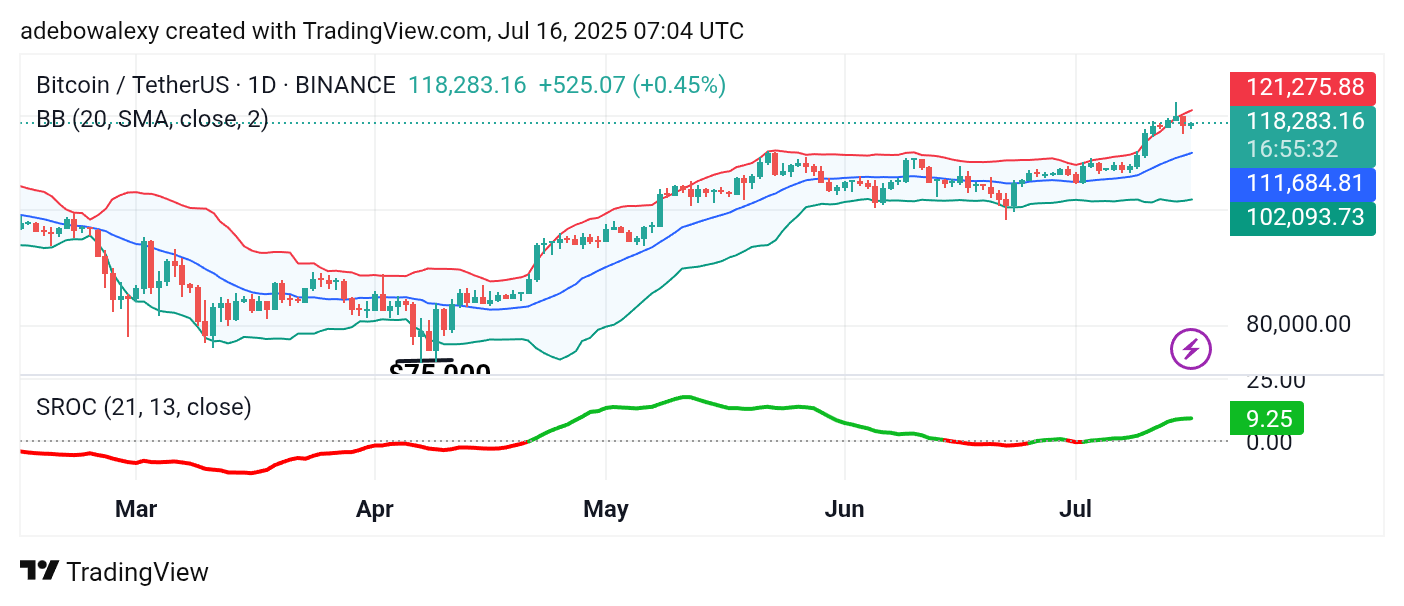
Price action in the Bitcoin market appears to have rebounded from the uppermost limit of the Bollinger Bands (BB) indicator. However, this rebound occurred during the previous session, while the ongoing session appears to be providing support against further price decline. As a result, price action remains above the middle band of the BB indicator, which itself continues along an upward trajectory.
Moreover, the Smoothed Rate of Change (SROC) indicator line remains above the equilibrium level and continues on a slight upward path, further supporting the bullish outlook.
Bitcoin (BTC) Price Prediction: BTC/USDT General Uptrend Remains Intact
Overall, the behaviour of the Bitcoin market continues to affirm a general uptrend. Despite a recent retreat, even a dip below the $117,000 level would still be considered moderate within the context of a strong upward trend.
Notably, bullish activity seems to be resurfacing, as reflected by the latest green price candle on the chart. Price action remains closer to the upper limit of the BB indicator, although reduced market activity suggests investors are exercising caution. Nevertheless, the SROC indicator line stays above the equilibrium level, maintaining a gentle upward slope. Technically, all current indicators suggest that Bitcoin may continue on an upward trajectory.
Bitcoin (BTC) Price Prediction: BTC/USDT Prepares to Build a Promising Base (4-Hour Chart)
On the 4-hour Bitcoin price chart, price action appears to be rising toward the middle band of the BB indicator from below. The latest green candle indicates bullish intent and is driving the market upward toward the central limit of the indicator.
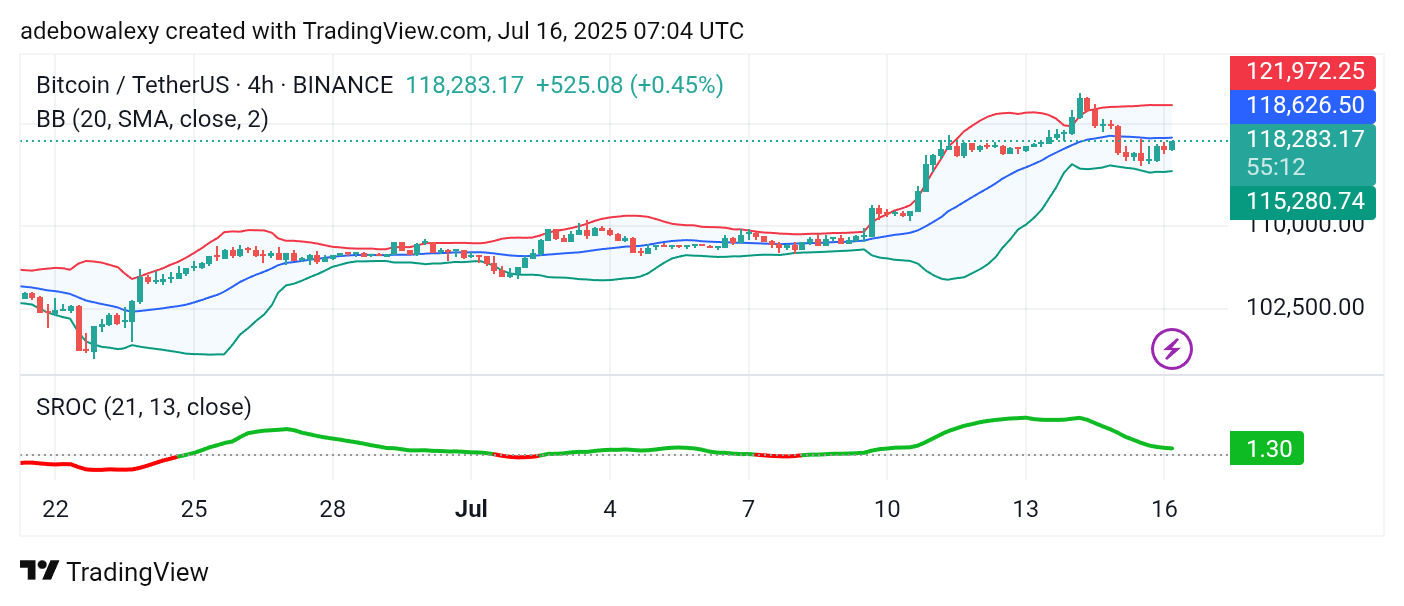
Unlike the daily chart, the BB bands on the 4-hour chart appear more horizontal, signaling a period of consolidation. Similarly, the SROC indicator line remains above the equilibrium level but has also shifted to a more sideways path due to recent price adjustments. Therefore, the market may offer short-term opportunities targeting the $122,000 level.