Litecoin (LTC) Price Prediction: LTC/USDT Sees a Notable Rejection
Estimated Reading Time: 3 minutes
Don’t invest unless you’re prepared to lose all the money you invest. This is a high-risk investment and you are unlikely to be protected if something goes wrong. Take 2 minutes to learn more

Date: July 15, 2025
The Litecoin market has recently made notable upward progress, breaching the resistance at the $90 price level. However, the market encountered rejection at the $96 mark. As of the time of analysis, the coin is trading around $92.36.
Litecoin (LTC) Price Prediction: LTC/USDT Long-Term Trend—Bullish (Daily Chart)
Key Price Levels
Resistance: $95, $100, $105
Support: $90, $85, $80
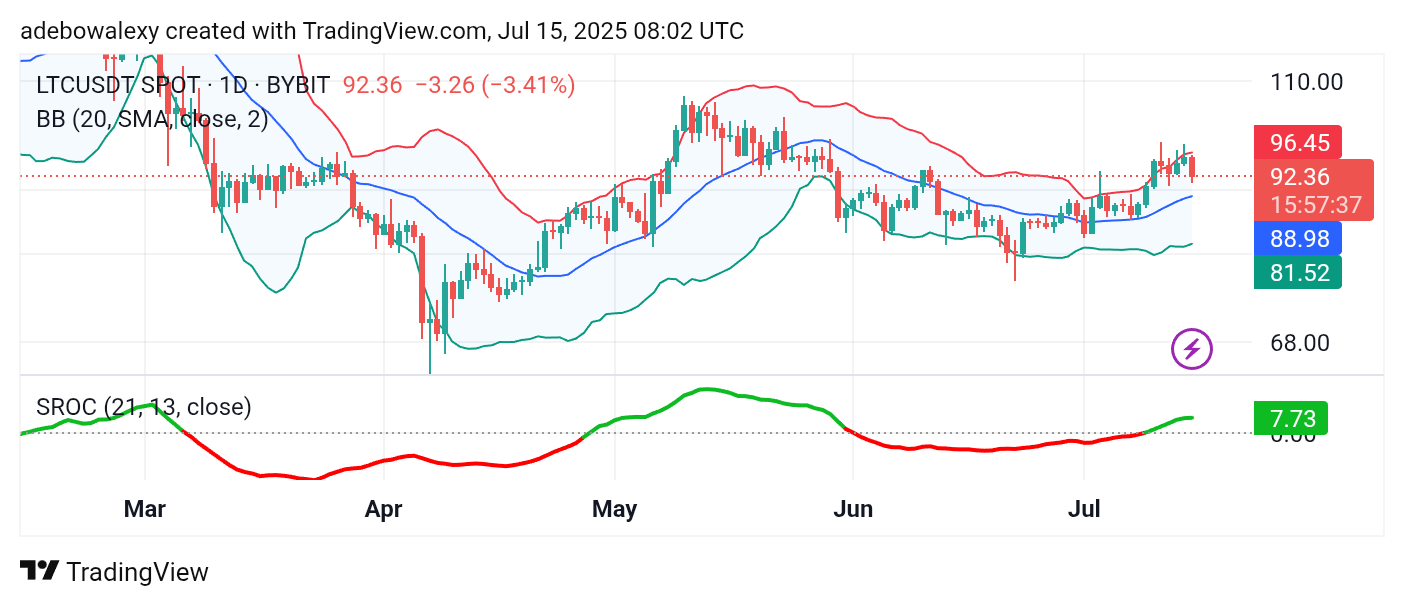
The last price candle on the daily chart appears red and prominent. Nonetheless, it remains above the middle band of the Bollinger Bands (BB) indicator, which itself maintains an overall upward slope. The Smoothed Rate of Change (SROC) indicator also remains above the equilibrium level. However, the tip of the SROC line shows a slight sideways movement, likely due to the ongoing rejection in the current session.
Litecoin (LTC) Price Prediction: LTC/USDT General Uptrend Remains Intact
Despite the notable setback in the current session, signals suggesting a potential continuation of the bullish trend still persist in the Litecoin market . Observably, price action has been rebounding since finding support at the $80 level and has continued on this upward path despite intermittent bearish pullbacks.
The SROC indicator line remains above the equilibrium level, with only a mild sideways bend, further supporting the view that the uptrend may still be in play.
Litecoin (LTC) Price Prediction: LTC/USDT Floats Above Lower Bands (4-Hour Chart)
On the 4-hour chart, Litecoin’s price recently rebounded from the lower band of the BB indicator. However, the current session has formed a small red candle, suggesting that bearish pressure is attempting to resist the rebound.
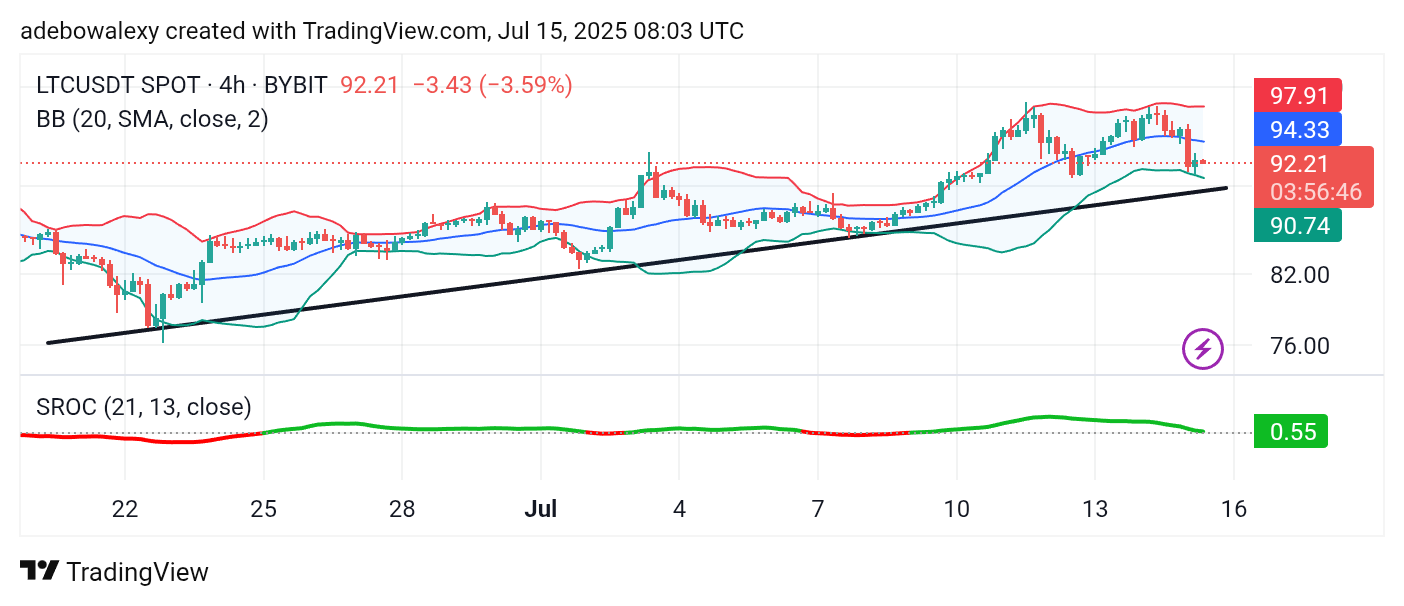
Still, the SROC indicator remains above the equilibrium level here, indicating ongoing bullish sentiment. The only difference is that the terminal end of the indicator is currently testing the equilibrium level. Nevertheless, traders may anticipate that this temporary setback could be overcome. Should that occur, the market might first challenge the middle band of the BB indicator and then attempt to advance toward the $100 resistance mark.
Get Litecoin (LTC) here. Buy LTC