Polkadot (DOT/USDT) Faces Heavy Pressure Near Key Support Zone
Estimated Reading Time: 3 minutes
Don’t invest unless you’re prepared to lose all the money you invest. This is a high-risk investment and you are unlikely to be protected if something goes wrong. Take 2 minutes to learn more
DOT/USDT Long-term Analysis: Ranging
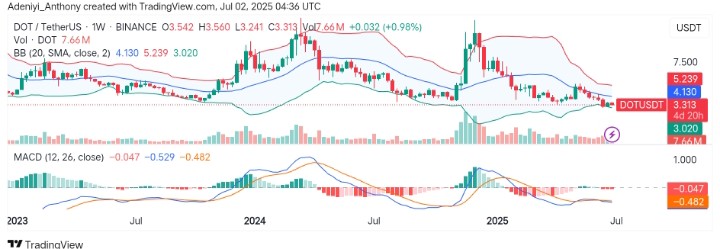
After facing significant selling pressure in early 2025, the market for Polkadot against the Tether has been in a steady downtrend, forming lower highs and lower lows. However, the Bollinger Bands are contracting, indicating low volatility and consolidation, while the price trades near the lower band, amplifying bearish continuation risk.
From the other end, the MACD shows continued downward momentum, with both the signal and MACD lines below zero, reinforcing the bearish view. However, this zone may act as a make-or-break level as the pair’s price closes around $3.31, a critical multi-month support zone.
Currently, Polkadot trades at $3.313, recording 7.66 million traded volumes for the week.
Technical Indicators
Major Resistance Levels: $4.130, $5.240, and $6.000
Major Support Levels: $3.020, $2.800, and $2.200
DOT Technical Analysis
The analysis of the Polkadot and Tether trading pair on the weekly chart shows that the market still wears a bearish outlook, aiming at the lower bound of the Bollinger with the formation of serial lows. However, the narrowing of the bands suggests the pair may be preparing for a bigger near this bottom as price consolidates.
On the other hand, the MACD signals a downtrend, pointing to a continued movement to the south as the volume indicates a lack of bullish conviction.
To this end, a close below $3.000 with improved bearish volume would indicate a further move to the south. Conversely, a break above the current level might signal the start of a journey towards $5.240.
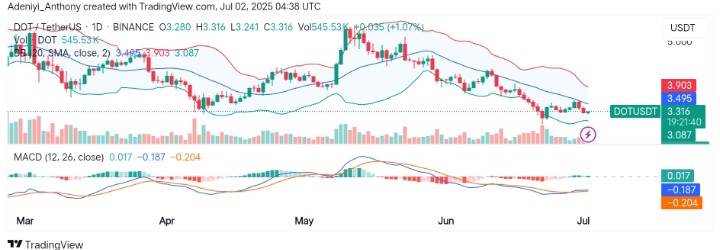
DOT/USDT Analysis: Market Shows Early Recovery Signs
The short-term, especially the daily chart of DOT/USDT, is showing signs of minor recovery after a sustained downtrend. However, the price is currently testing the mid-Bollinger Band and just printed a small bullish candle, closing at $3.316, up +1.07% for the day. However, the bands are lightly expanding downward, but the price is trying to reclaim the middle band.
On the other hand, the MACD shows early signs of a bullish crossover as the histogram turns green even with improving bullish participation.
To this end, a close above $3.500 is needed to confirm a bullish move; otherwise, failure to break above $3.08 may lead to a retest of $2.800.
You can purchase crypto coins here. Buy LBlock