Polygon (MATIC/USD) Market Holds a Fall Sign Below $0.70, Following a Rejection
Estimated Reading Time: 3 minutes
Don’t invest unless you’re prepared to lose all the money you invest. This is a high-risk investment and you are unlikely to be protected if something goes wrong. Take 2 minutes to learn more
Polygon Price Prediction – July 2
The present trading situation in the MATIC/USD market operations holds a fall sign below the $0.70 resistance, following a rejection to set in a barrier that buyers will not surge higher past it.
Psychologically, despite the fact that the crypto-economic stance has been lowly priced, it is under a risk of showcasing another round of declines that might feature in lower lows formation with less-active motions to the downside as the transaction activities have been held between the maximal and the minimal points of $0.678 and $0.662 at a minute negative percentage average of 0.74. It appears that some traits of the recession cycle may not be overlooked for a while during the next couple of days.
MATIC/USD Market
Key Levels:
Resistance levels: $0.70, $0.75, $0.80
Support levels: $0.50, $0.45, $0.40
MATICUSD – Daily Chart
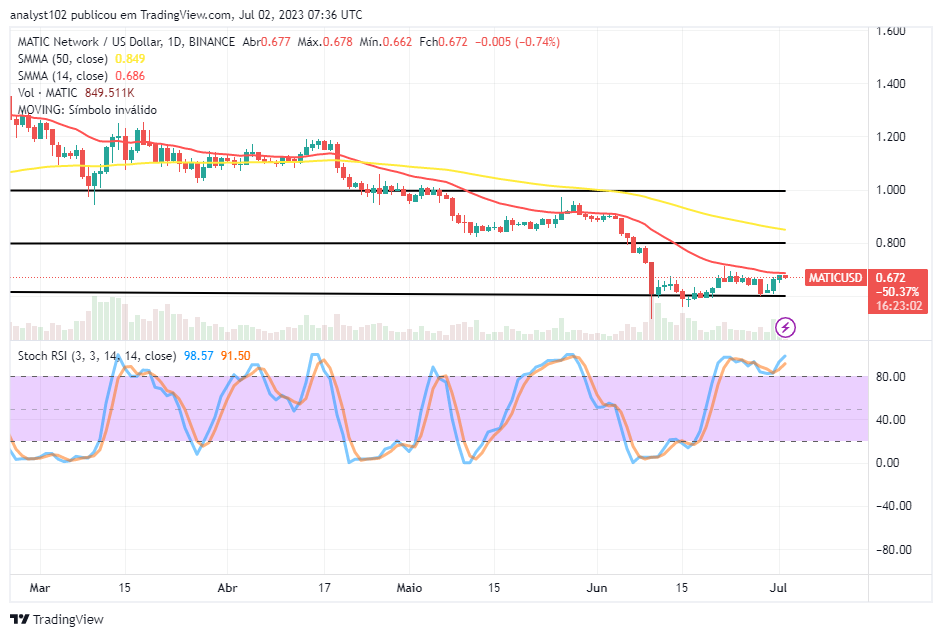
The MATIC/USD daily showcases the crypto-economic market holding a fall sign below the $0.070 resistance line, following a rejection.
The 50-day SMA indicator places $0.0686 beneath the $0.0849 value line of the 50-day SMA indicator. The Stochastic Oscillators are positioned in the overbought region between 91.50 and 98.57 points. It appears that buyers will be in a state of respite to regain the needed velocity to nudge back into a northward rise.
Will there be more downs below the resistance line of $0.070 as regards MATIC/USD market operations?
A lot of gravitational values to the upside seem to have lost considerably with the reading condition of the Stochastic Oscillators in the MATICUSD market as the price holds a fall sign below the $0.70 level following a rejection.
Long-position placers will have to be patient toward achieving another round of formation patterns to portray that the velocity to the upside is reset at lower trading points of the Oscillators before taking to buying order positions afterward.
Bears may need to watch out for active depressing moments from around the resistance of $0.70 to launch an instant shorting order position with the execution of a stop loss around the higher resistance level of $0.080 to guard against any unfrequented upsurges that can arise.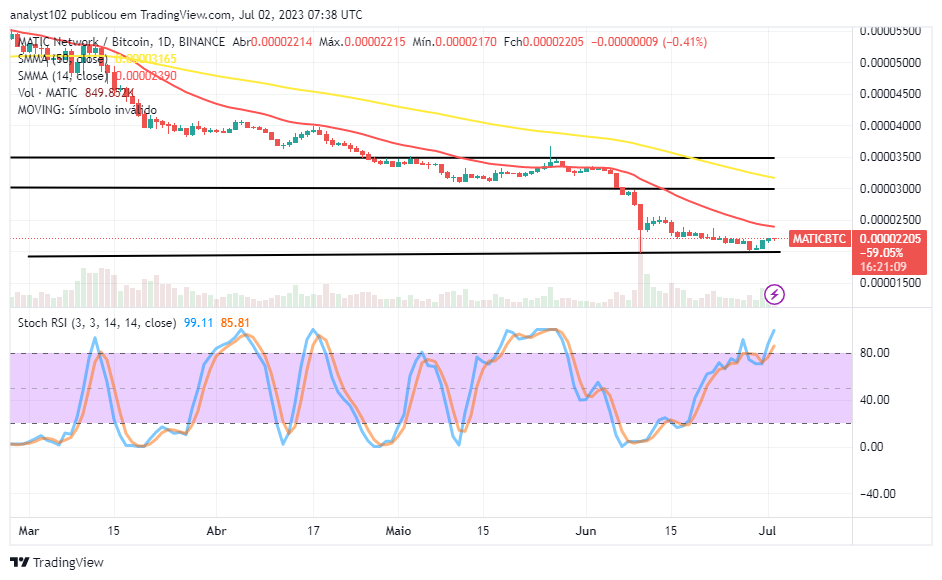
MATIC/BTC Price Analysis
In comparison, the Polygon trade operation has vastly exhausted its weight to push against Bitcoin, even though it is still placed underneath the sell signal sides of the SMAs. In other words, the pairing crypto price holds a fall sign below the indicators.
The 50-day SMA indicator is above the 14-day SMA indicator, suggesting that the level of depression might be maintained for a long time. The Stochastic Oscillators are positioned between 85.81 and 99.11. The outlook of the current trade arrangement portends that a degree of repositioning is still needed toward the lower trade zone before bulls can breathe again and shoot up for recoveries.
Note: Cryptosignals.org is not a financial advisor. Do your research before investing your funds in any financial asset or presented product or event. We are not responsible for your investing results.
You can purchase Lucky Block here. Buy LBLOCK