Dogecoin (DOGE/USD) Price Rejects at $0.070, Setting in a Correction
Estimated Reading Time: 4 minutes
Don’t invest unless you’re prepared to lose all the money you invest. This is a high-risk investment and you are unlikely to be protected if something goes wrong. Take 2 minutes to learn more
Dogecoin Price Prediction – June 26
The DOGE/USD market’s price has rejected to break through the $0.070 resistance line, setting in a correction in a lighter mode even though bears are having the upper hand.
The impacts of transactions have been made on the market between buyers and sellers, featuring in the trade zones of $0.0671 and $0.0654 at a minute percentage rate of 0.60 negative. As it has been showcased, selling reactions are liable to feature in slow motion that might not attract decent shorting entries in the progression from the rejection axis to a lower-trading spot of around $0.060. It would be psychologically ideal for only short-term traders to play alongside the decline move whenever the opportunity comes up.
DOGE/USD Market
Key Levels:
Resistance levels: $0.070, $0.075, $0.080
Support levels: $0.050, $0.045, $0.040
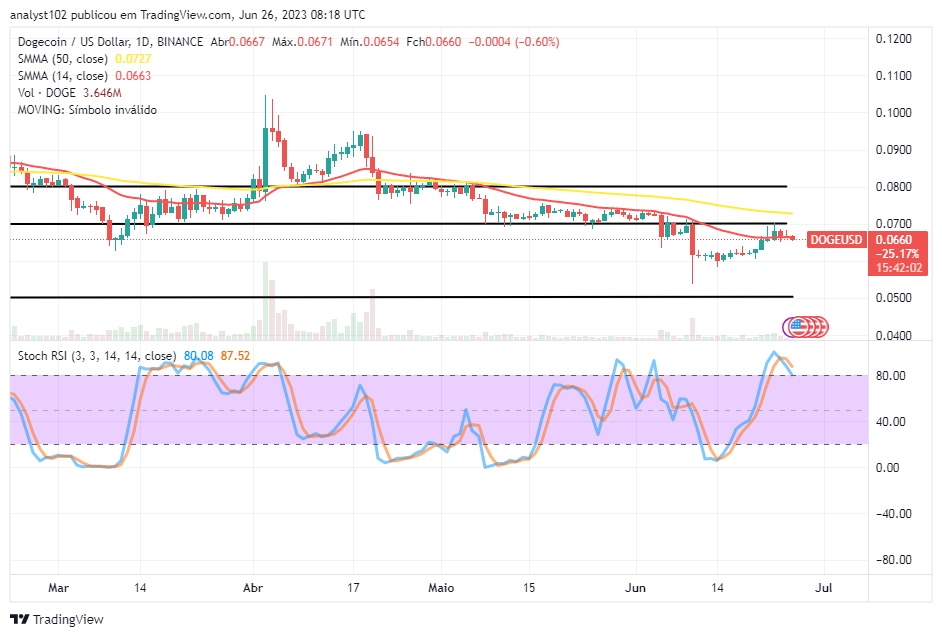
DOGE/USD – Daily Chart
The DOGE/USD daily showcases the crypto-economic price rejection at $0.070, setting in a correction from the zones between the trend lines of the SMAs.
The 14-day SMA indicator is positioned at the $0.0663 point underneath the $0.0727 value line of the 50-day SMA indicator. The mid-horizontal line is drawn at the $0.070 resistance spot, making it the crucial point for the rises ahead. The Stochastic Oscillators have slightly crossed southbound in the overbought region to 87.52 to 80.08 levels. That signifies that shorting operations are relatively ongoing.
Where should the stop-loss order area be for the trade bears if the DOGE/USD market purchasers had to lose more catalysts at this time?
According to the look of the trade happenings currently in the business operations of the DOGE/USD, selling moments tend to have the highest prevalence index as the crypto-economic price rejects $0.070 resistance, setting in a correction move underneath.
In the meantime, short-position takers might run their position on a timely-sensitive basis by utilizing an instant position entry order with a stop-loss order executed around the value of the 50-day SMA to guard against any unexpected situation that can metamorphose into a rebounding motion.
Concerning the valuation increment process of the DOGE/USD technical analysis, buyers are to exercise some degrees of caution toward ensuring that the market gets repositioned with a lesser propensity of downsizing by what will be the outcome of the Stochastic Oscillators stances at reduction levels before going for longing orders afterward.
DOGE/BTC Price Analysis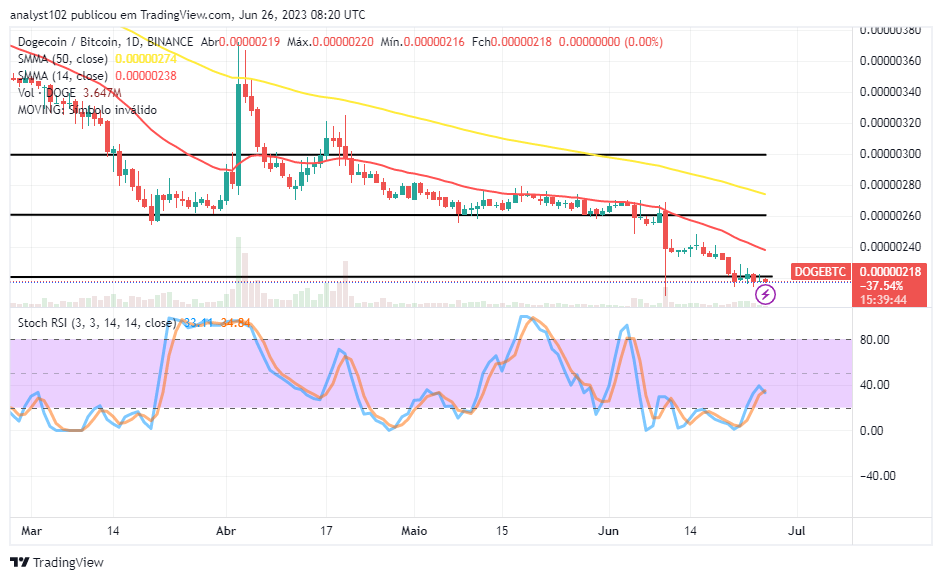
In comparison, Dogecoin has been placed under retrogressive movement against the valuation of Bitcoin below the SMA trend lines. Presently, the pairing crypto market’s price is setting in a correction around the lower horizontal line drawn.
The 14-day SMA indicator is underneath the 50-day SMA indicator. And they are at the top spot, pointing toward the south to signify the base crypto still risks shifting more to the downside. The Stochastic Oscillators have managed to spring up from the oversold region to bag a brief crossing of their lines at 40, keeping 34.84 to 33.11 levels to the south. That implies that every indicator suggests about seventy percent of the probability that bears may still excel in the next operation if bulls continually fail to muscle up.
Note: Cryptosignals.org is not a financial advisor. Do your research before investing your funds in any financial asset or presented product or event. We are not responsible for your investing results.
You can purchase Lucky Block here. Buy LBLOCK