Dogecoin (DOGE/USD) Market Could Go Lower, Following the Current Ranges
Estimated Reading Time: 3 minutes
Don’t invest unless you’re prepared to lose all the money you invest. This is a high-risk investment and you are unlikely to be protected if something goes wrong. Take 2 minutes to learn more
Dogecoin Price Prediction – June 19
The Dogecoin market could go lower, following the current range of around $0.060. Over time, transactions have concurrently featured around the value line, characterized by a high of $0.0623 and a low of $0.0616, as it trades around $0.0621 at a 0.32% negative. However, bears need to rely on a velocity to push southerly from those points outlined earlier to revisit the lower support line of $0.050 after waiting for a formation pattern signaling every indication to have lost momentum to push upside.
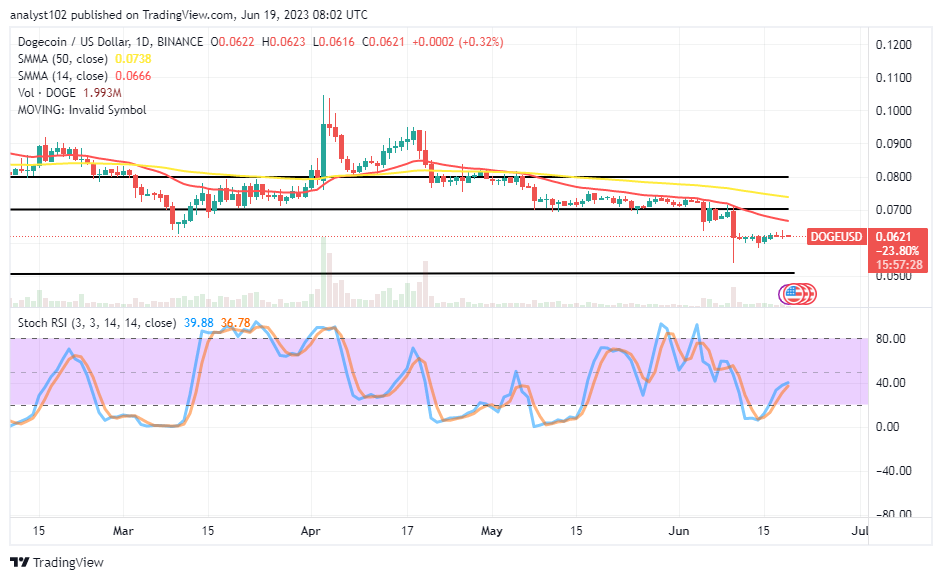
DOGE/USD Market
Key Levels:
Resistance levels: $0.070, $0.075, $0.080
Support levels: $0.050, $0.045, $0.040
DOGE/USD – Daily Chart
The DOGE/USD daily showcases the crypto market could go lower, following the current ranges underneath the trend lines of the SMAs. The 14-day SMA indicator is at $0.0666 below the $0.0738 value line of the 50-day SMA indicator. The Stochastic Oscillators have traversed northbound from the oversold region to positions 36.78 to 39.88. And it appears they are attempting to change their position to portray the prospect of suspending the trading situation.
What is the near flash barrier trade zone to the present trade capacity in the DOGE/USD market operations?
The mostly-challenging resistance in the DOGE/USD market has steadily been around the trend line of the 14-day SMA, suggesting that the crypto economy could go lower, following the current ranges style of transactions over the past couple of days. However, long-position takers may be technically healthier in their trade approach by using a buy limit order toward or around the support of $0.05 to ambush the possibility of falling force in the aftermath and further drawbacks.
As regards the devaluation of the DOGE/USD technical analysis, from the technical trade outlook, an upward force has to hit resistance around the point of the smaller SMA or in an extension of the $0.070 resistance level before securing a decent shorting position order. A stop-loss order slightly above the value line before $0.075 is required to support the instant execution of the sell order at this time.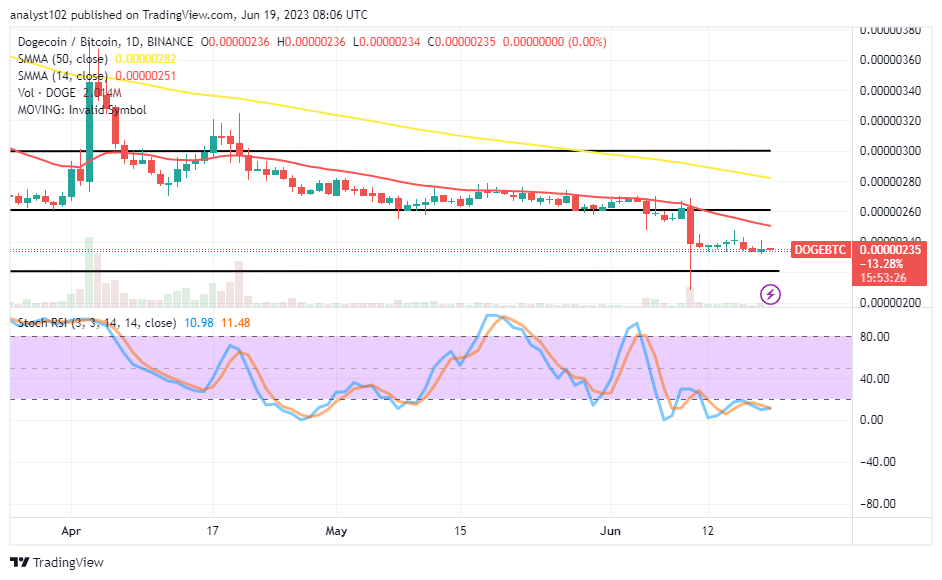
DOGE/BTC Price Analysis
In comparison, the Dogecoin trade could still go lower against Bitcoin operations, following the mood of the current range if the latter crypto-trading instrument consolidates its movement dearly. The 14-day SMA trend line is underneath the 50-day SMA trend line. And they are above the present trading spots. The Stochastic Oscillators are featured around the 20 level and some parts of the oversold region, making the moves in a consolidation manner. In the meantime, long-term position buyers may start fishing out ways to make a comeback at this time.
Note: Cryptosignals.org is not a financial advisor. Do your research before investing your funds in any financial asset or presented product or event. We are not responsible for your investing results.
You can purchase Lucky Block here. Buy LBLOCK