Avalanche Price Prediction: AVAX/USD Back Below $10.87 Level
Estimated Reading Time: 3 minutes
Don’t invest unless you’re prepared to lose all the money you invest. This is a high-risk investment and you are unlikely to be protected if something goes wrong. Take 2 minutes to learn more
Avalanche Price Prediction – August 21
The Avalanche price is facing an intense tug of war as bears mount pressure near $10.20, taking the market price back below the $10.00 support zone.
AVAX/USD Long-term Trend: Bearish (Daily Chart)
Key levels:
Resistance Levels: $13.00, $14.00, $15.00
Support Levels: $8.00, $7.00, $6.00
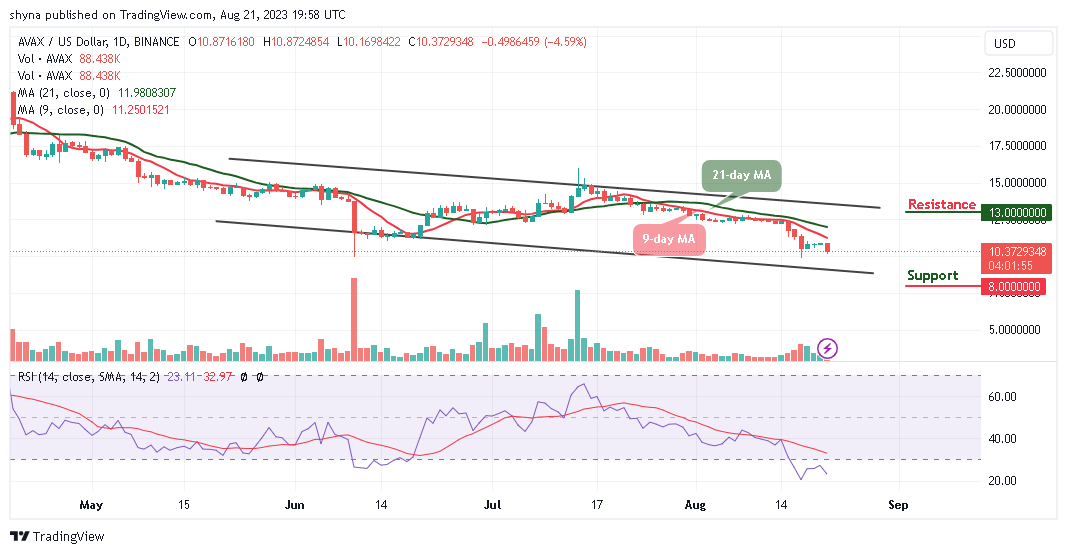
AVAX/USD is currently facing the downside as the coin heads toward the lower boundary of the channel, the bulls failed to push the market price above the 9-day and 21-day moving averages as the stagnation near the $10.90 level shows that the pair is unable to increase volume to reach critical mass and overcome key hurdles with confidence.
Avalanche Price Prediction: Could it be Bearish Confirmation?
The Avalanche price has not had much action as the coin keeps trading below the moving averages. Meanwhile, the support and resistance levels have ensured that the daily charts are not very volatile but the price could challenge the lower boundary of the channel and hit the nearest support level at $9.00. However, the sudden drop could make the bulls defend the $10.10 support zone after which the coin could face upward movement.
Nevertheless, the Avalanche price couldn’t go higher as it is likely to drop further below the 9-day and 21-day moving averages. Although the candle has not yet close and the bulls are unlikely to close above the opening price. Moreover, should the technical indicator Relative Strength Index (14) moves into the oversold region, the market price may touch the supports at $8.00, $7.00, and $6.00 but on the contrary, crossing above the upper boundary of the channel could touch the resistance levels of $13.00, $14.00, and $15.00.
AVAX/USD Medium-Term Trend: Bearish (4H Chart)
Looking at the 4-hour chart, the bears are seen coming back into the market as the bulls failed to push the market price above the 9-day and 21-day moving averages. However, $9.00 and below may come into play if the bearish momentum increases the market movement.
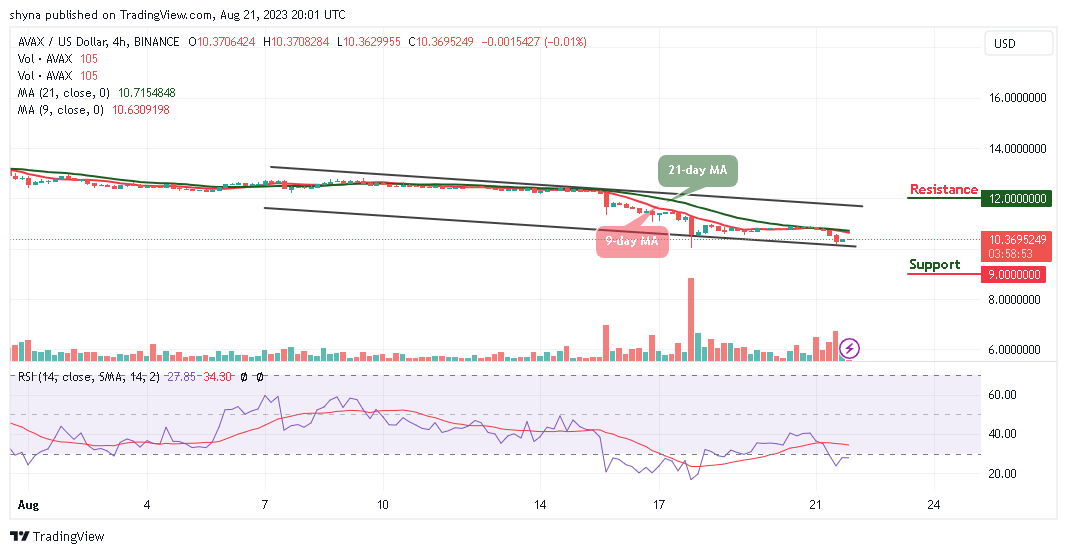
Meanwhile, if the buyers hijack the current movement and head toward the upper boundary of the channel, traders may expect a retest at an $11.00 resistance level; breaking this level may further allow the bulls to touch $12.00 and above. At the moment, the Relative Strength Index (14) signal line is seen moving below the 35-level which could give additional bearish signals in the next negative move.
You can purchase Avalanche here. Buy AVAX