Avalanche Price Prediction: AVAX/USD Hits $12.4 Resistance, What Next?
Estimated Reading Time: 3 minutes
Don’t invest unless you’re prepared to lose all the money you invest. This is a high-risk investment and you are unlikely to be protected if something goes wrong. Take 2 minutes to learn more
Avalanche Price Prediction – August 14
The Avalanche price prediction shows that AVAX is likely to cross above the 21-day moving average as the coin begins the upward movement.
AVAX/USD Market
Key Levels:
Resistance levels: $15.0, $15.5, $16.0
Support levels: $10.0, $9.5, $9.0
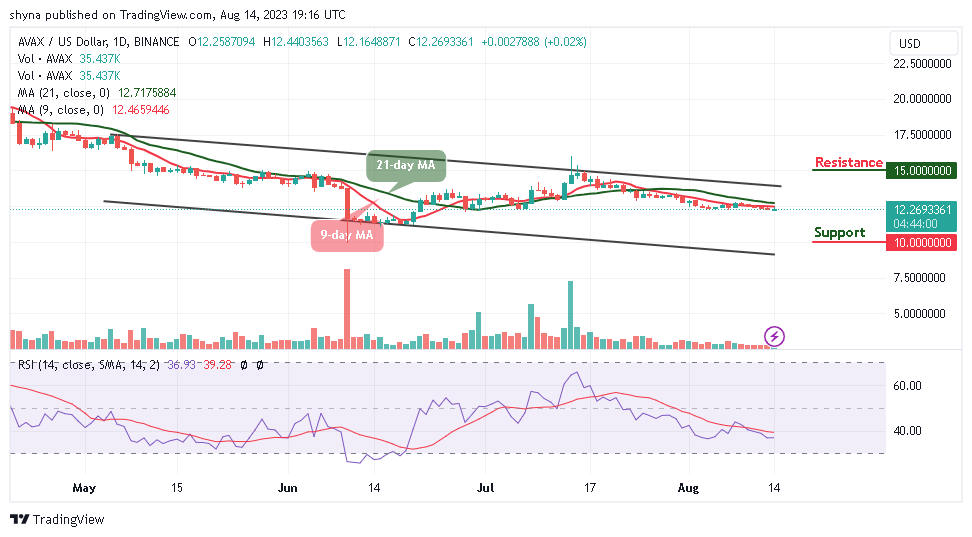
AVAX/USD is currently trading at $12.2 after touching the daily high at $12.4 and may climb above the 9-day and 21-day moving averages if the buyers put in more effort. However, in case the buyers were able to push the price above the resistance level of $12.5, it is likely for the daily candlestick to close above this level, and the price could rally toward the upper boundary of the channel.
Avalanche Price Prediction: Avalanche Could Rally to the Upside
According to the daily chart, the Avalanche price is moving close to the resistance level of $12.5 as the coin prepares to create an additional gain. The technical indicator Relative Strength Index (14) is moving to cross above the 40-level.
Nevertheless, if the buyers were able to push the price above the moving averages, the Avalanche price may rally toward the upper boundary of the channel to hit the potential resistance levels of $15.0, $15.5, and $16.0 while sliding toward the lower boundary of the channel could bring the coin to the support at $10.0, $9.5, and $9.0 respectively.
On the 4-hour chart, the Avalanche is also following a bearish movement, and it may slide to cross below the lower boundary of the channel which could locate the support level at $11.80 and below. On the other hand, if the market price crosses above the upper boundary of the channel, it could reach the resistance level of $13.0 and above.
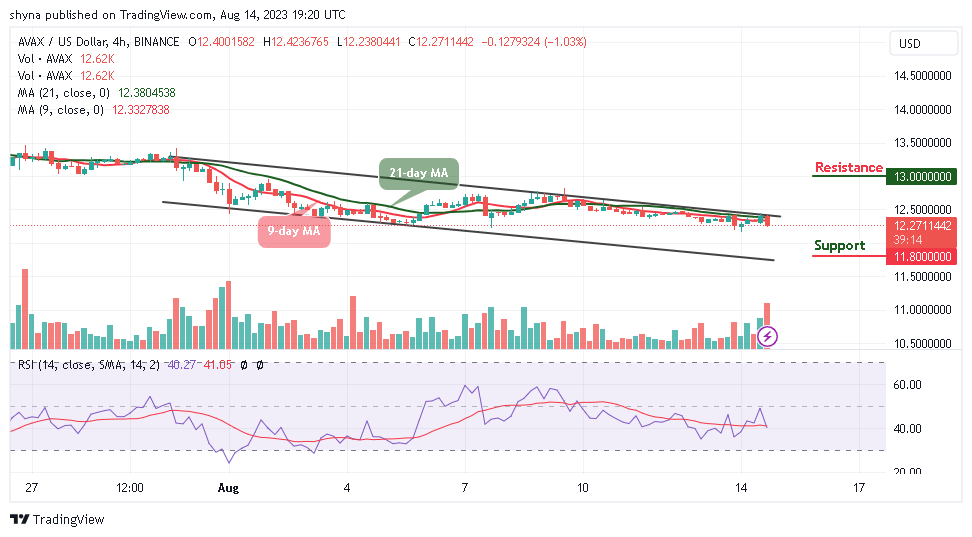
However, the technical indicator Relative Strength Index (14) is likely to cross below the 40-level as the signal line points to the south to confirm the bearish movement. Moreover, any further bearish movement may bring the coin toward the lower boundary of the channel.
You can purchase Avalanche here. Buy AVAX