Chainlink (LINK) Falls and Attempts to Revisit the Previous Low at $16
Estimated Reading Time: 2 minutes
Don’t invest unless you’re prepared to lose all the money you invest. This is a high-risk investment and you are unlikely to be protected if something goes wrong. Take 2 minutes to learn more
Chainlink (LINK) Long-Term Analysis: Bearish
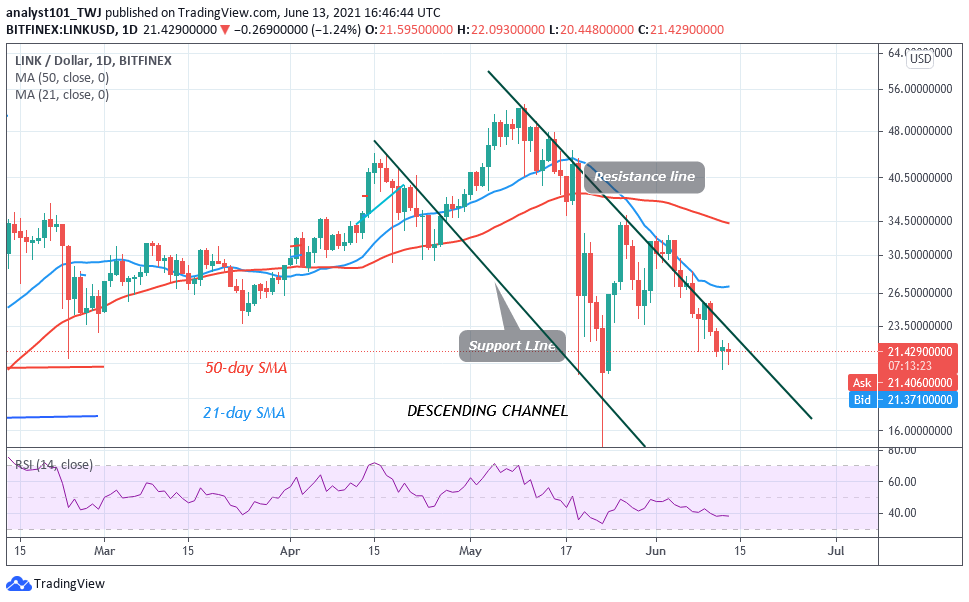
Chainlink’s (LINK) price is making an upward correction after retesting the previous low at $20.50. The upward correction is approaching the high of $22.50.Chainlink is likely to face another rejection at the $22.20 high. The downtrend will resume if LINK turns from the $22.20 resistance zone.
Chainlink (LINK) Indicator Analysis
The crypto has fallen to level 38 of the Relative Strength Index period 14. It indicates that it is in the downtrend zone and it is approaching the oversold region. Chainlink is in the bearish trend zone as the crypto is ln the bearish trend zone. The 21-day SMA and 50-day SMA are sloping southward indicating the downtrend.

Technical indicators:
Major Resistance Levels – $60, $62, $ 64
Major Support Levels – $30, $28, $26
.
What Is the Next Direction for Chainlink (LINK)?
On the 4 –hour chart, Chainlink rebounds above the current support as price attempts to break above the 21-day SMA. Meanwhile, on May 30 downtrend; a retraced candle body tested the 61.8% Fibonacci retracement level. This retracement indicates that the market will fall to level 1.618 Fibonacci extensions or the low of $16.27. LINK is rising but may face rejection at the 21-day SMA.

Note: new.cryptosignals.org is not a financial advisor. Do your research before investing your funds in any financial asset or presented product or event. We are not responsible for your investing result