Ripple Is in an Upward Move as It Battles the $0.32 High
Estimated Reading Time: 2 minutes
Don’t invest unless you’re prepared to lose all the money you invest. This is a high-risk investment and you are unlikely to be protected if something goes wrong. Take 2 minutes to learn more

Free Crypto Signals Channel
Ripple (XRP) Long-Term Analysis: Bearish
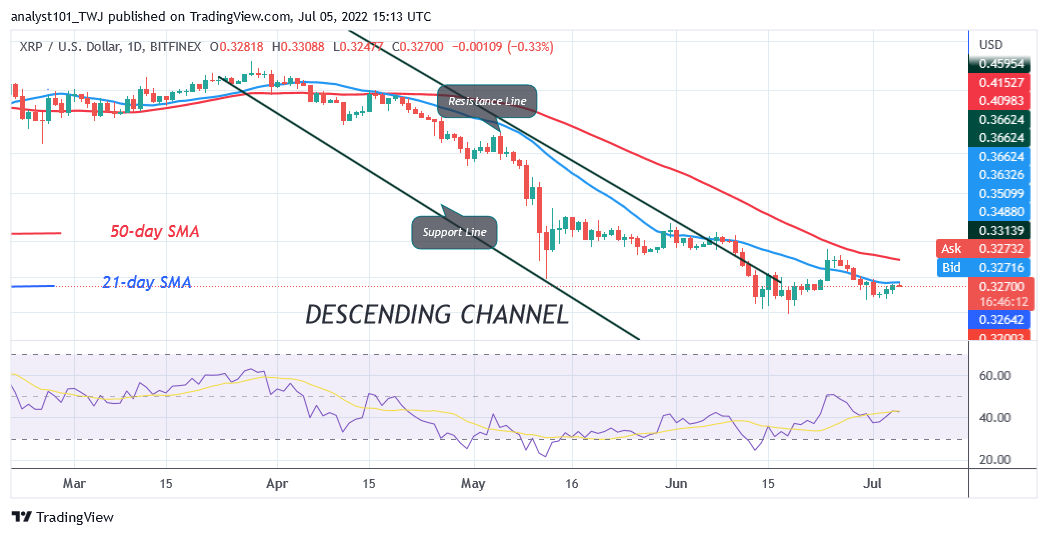
Ripple’s (XRP) price holds above $0.30 as it battles the $0.32 high. The upward correction has been terminated at the high of $0.32. The uptrend is facing rejection at the recent high. It is being restricted by the 21-day line SMA. A break above the 21-day line SMA will accelerate the upward move. The coin will rally to the $0.38 high or above the 50-day line SMA. The bullish momentum will extend to the high of $0.46. On the other hand, if the bullish scenario is invalidated, the altcoin will fall and revisit the previous low at $0.30.
Ripple (XRP) Indicator Analysis
The cryptocurrency is at level 40 of the Relative Strength Index for period 14. XRP is in the downtrend zone and it is capable of further decline. The altcoin is below the 30% range of the daily stochastic. The crypto is in a bearish momentum. Also, XRP’s price bars are below the moving averages which indicates a further decline.
Technical indicators:
Major Resistance Levels – $2.00, $2.50, $3.00
Major Support Levels – $1.50, $1.00, $0.50
What Is the Next Direction for Ripple (XRP)?
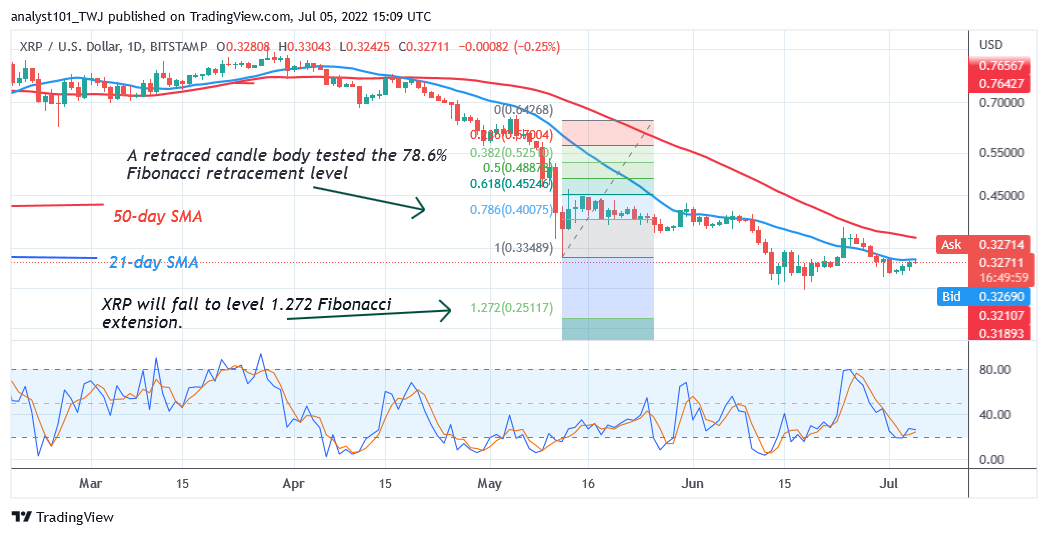
Ripple can decline further as it battles the $0.32 high. Besides, a further upward move is doubtful. Meanwhile, on May 12 downtrend; a retraced candle body tested the 78.6% Fibonacci retracement level. The retracement suggests that XRP will fall to level 1.272 Fibonacci extension or level $0.25.
You can purchase crypto coins here. Buy LBlock
Note: Cryptosignals.org is not a financial advisor. Do your research before investing your funds in any financial asset or presented product or event. We are not responsible for your investing results