Ethereum (ETH/USD) Market Lowers at $4,000
Estimated Reading Time: 3 minutes
Don’t invest unless you’re prepared to lose all the money you invest. This is a high-risk investment and you are unlikely to be protected if something goes wrong. Take 2 minutes to learn more
Ethereum Price Prediction – December 20
The ETH/USD trade record has had it that the crypto-economic market lowers at $4,000, trading around $3,820. The crypto’s percentage rate, estimated at 2.66 negatives.
ETH/USD Market
Key Levels:
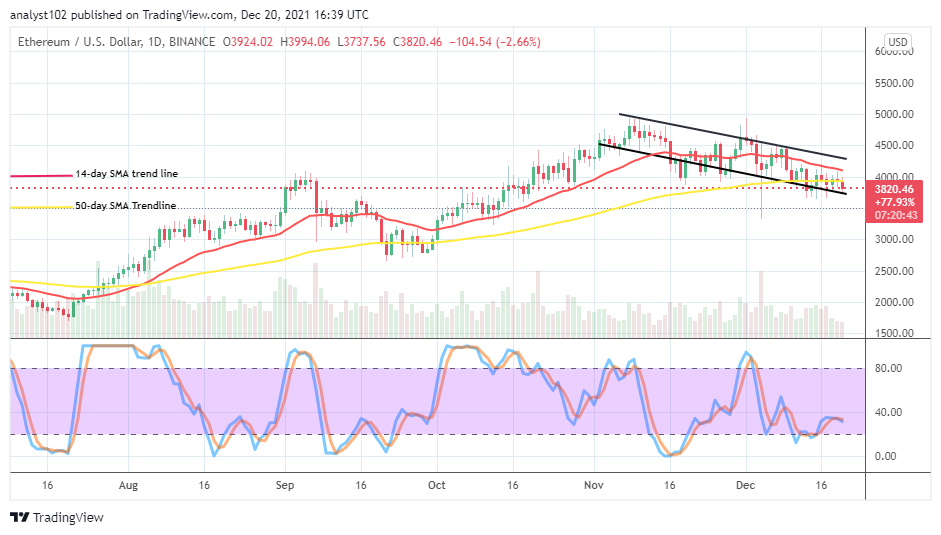
Resistance levels: $4,250, $4,500, $4,750
Support levels: $3,750, $3,500, $3,250
ETH/USD – Daily Chart
The ETH/USD daily chart reveals that the crypto market operation lowers at $4,000. And, it observed that price has severally been featuring beneath the value line to locate support. There has been not much difference in the positioning outlook of the bearish correction of the crypto economy as it has been over time. The Stochastic Oscillators are in the ranges of 20 and 40, conjoining the lines closely beneath the higher range value-line. That signifies the possibility of the market resulting in a pit stop condition.
Will the ETH/USD price valuation lose sustainably more to the downside as the market lowers at $4,000?
There has been a persistent occurrence that the ETH/USD price valuation goes down beneath the $4,000 level to find support. The crypto market, as of writing, lowers at $4,000 to seemingly give the same situation. Based on that, long-position takers have to be on the lookout for a rebounding attempt to launch a buy order.
On the downside of the technical analysis, the ETH/USD market short-position takers may as well continue to look out for a higher-trading spot within or around the upper bearish trend line before considering a sell order. In the wake of a sudden fearful breakout at $4,500, it will be difficult to get a quick suitable decent re-entering of a sell order at that trading capacity level afterward.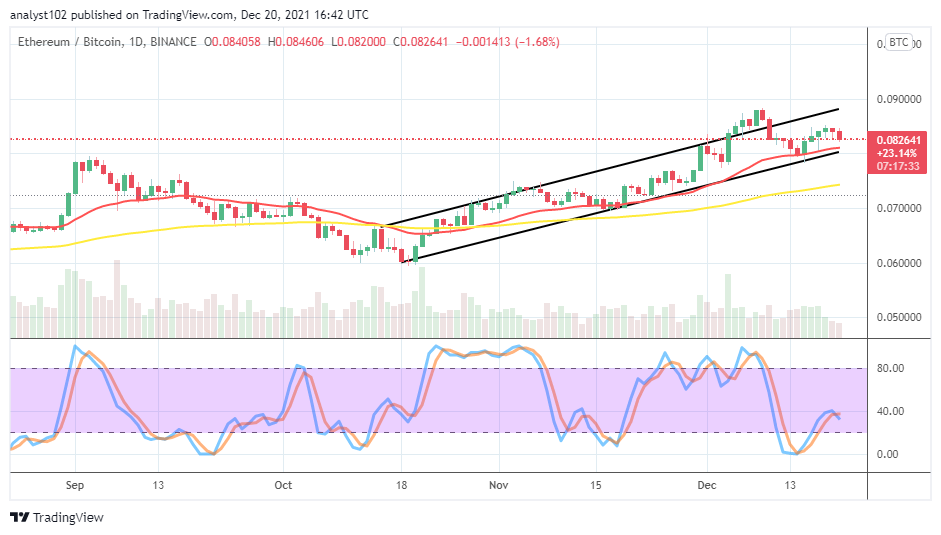
ETH/BTC Price Analysis
In comparison, the trending outlook between Ethereum and Bitcoin portends that the base crypto, still to some extent, prevails over the counter trading crypto until the present despite an occurrence of a correction. All the variant candlesticks are featured, on the buy-side of the smaller SMA’s trend line. The 50-day SMA indicator is underneath the 14-day SMA indicator. The Stochastic Oscillators have moved northbound from the oversold region to cross the lines briefly at range 40. That signifies that the base crypto is experiencing a pause presently.
Note: Cryptosignals.org is not a financial advisor. Do your research before investing your funds in any financial asset or presented product or event. We are not responsible for your investing results.
You can purchase crypto coins here. Buy Tokens