Quant Price Prediction: QNT/USD Consolidates Below $110; Price Could Take Support from $100
Estimated Reading Time: 3 minutes
Don’t invest unless you’re prepared to lose all the money you invest. This is a high-risk investment and you are unlikely to be protected if something goes wrong. Take 2 minutes to learn more
Quant Price Prediction – December 21
The Quant price prediction will begin to form higher as soon as the coin crosses above the 9-day and 21-day moving averages.
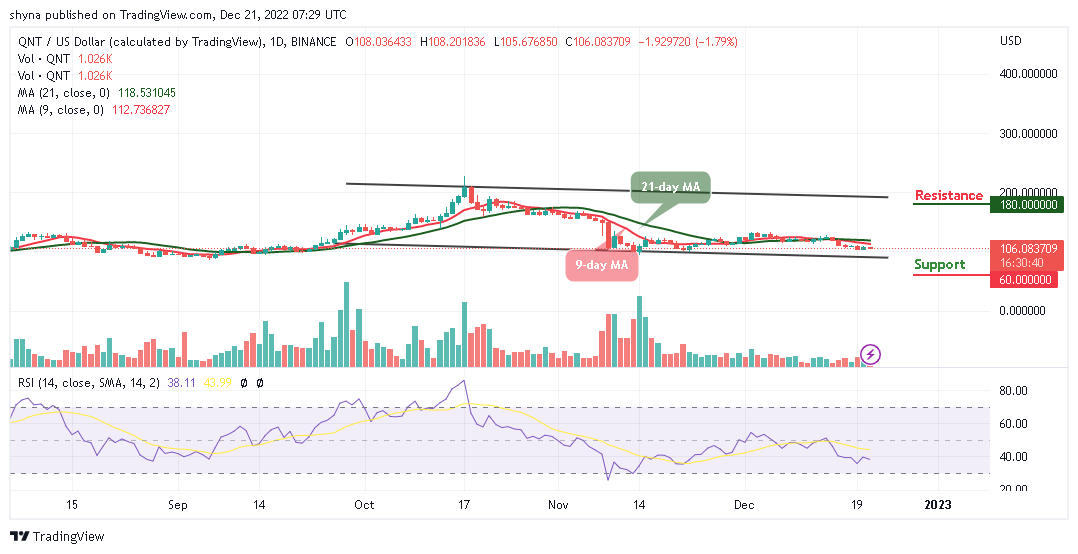
QNT/USD Medium-term Trend: Ranging (1D Chart)
Key Levels:
Resistance levels: $180, $200, $220
Support levels: $60, $40, $20
QNT/USD is still hovering below the 9-day and 21-day moving averages; it’s yet to get head to the upside and this could be the best time to buy. At the time of writing, the market price is hovering at $106, and it could slide below the daily lower of $105.6 to allow new investors to come into the market.
Quant Price Prediction: QNT/USD Will Retrace Back to the Top
The Quant price will make a retracement back above the 9-day and 21-day moving averages as the bulls defend the $105 support. However, any bullish cross above the moving averages could push the coin toward the upper boundary of the channel which will hit the potential resistance levels of $180, $200, and $220 respectively.
Nevertheless, the current analysis could be delayed if the bears break below the lower boundary of the channel and could fall to the support levels of $60, $40, and $20. Similarly, the technical indicator Relative Strength Index (14) remains below the 40-level to prepare the coin for the bullish movement in the next positive direction.
QNT/USD Medium-term Trend: Ranging (4H Chart)
According to the 4-hour chart, the Quant price is ranging below the 9-day and 21-day moving averages. The new buyers and the existing buyers are expected to come into the market; the long-term moving averages will begin the bullish movement as the market prepares for a new trend.
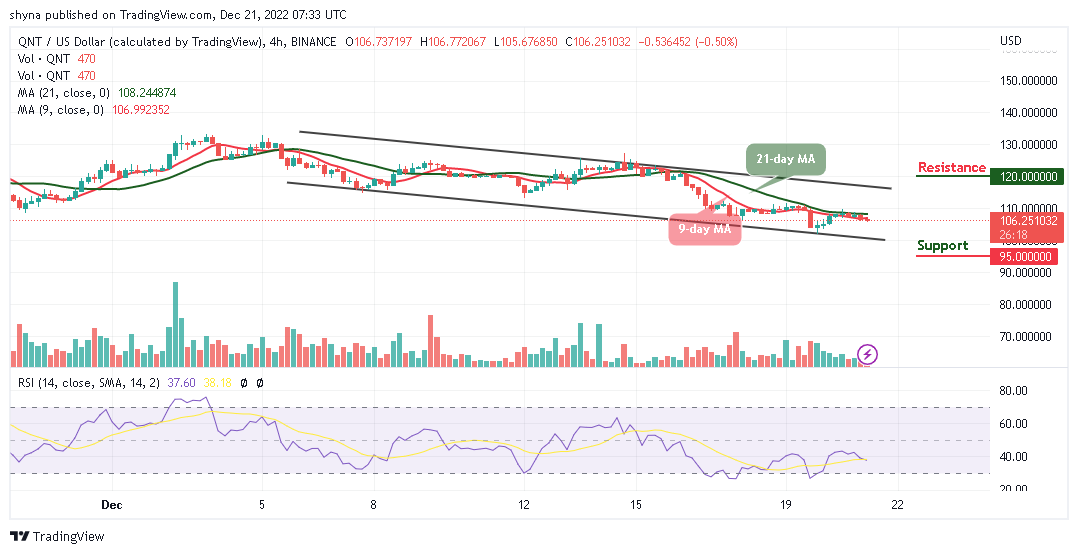
Moreover, if the buyers push the price toward the north, it could reach a higher resistance level at $120 and above. At the moment, the technical indicator Relative Strength Index (14) crosses below the 40-level, and should the bulls fail to move the current market value upward, the bears could bring the coin to the support level of $95 and below.
Place winning Quant trades with us. Get QNT here