Dogecoin (DOGE) Price Prediction: DOGE/USDT Heads Towards $0.3000
Estimated Reading Time: 3 minutes
Don’t invest unless you’re prepared to lose all the money you invest. This is a high-risk investment and you are unlikely to be protected if something goes wrong. Take 2 minutes to learn more
Date: July 21, 2025
The Dogecoin market has been surging back to life. Price activity in this market is racing toward a multi-month resistance level. Additionally, price action is crossing important technical landmarks that support further price increases. Let’s take a closer look at the market.
Dogecoin (DOGE) Price Prediction: DOGE/USDT Long-Term Trend—Bullish (Daily Chart)
Key Price Levels
Resistance: $0.3000, $0.3500, $0.4000
Support: $0.2500, $0.2000, $0.1500
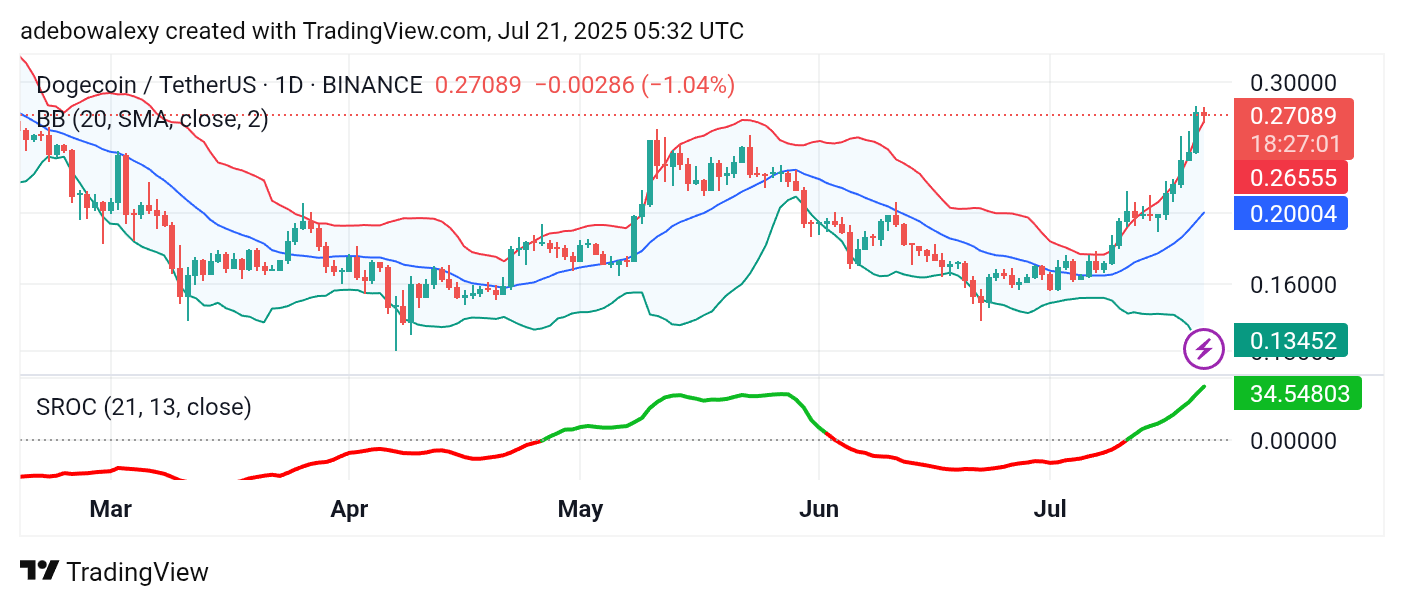
The Dogecoin market on the daily chart remains strongly bullish. Although the most recent price candle is red, it stands above the upper band of the Bollinger Bands (BB) indicator. The BB indicator itself remains significantly widened, though it still seems to lag behind the bullish momentum in the market.
Meanwhile, the trajectory of the Smoothed Rate of Change (SROC) indicator has continued upward ever since crossing above the equilibrium level, reinforcing the bullish outlook.
Dogecoin (DOGE) Price Prediction: DOGE/USDT Bulls Stay Ahead
For an extended period—spanning around two weeks—Dogecoin’s price action has remained buoyant. Recent price candles indicate increased momentum, especially notable in the candle from five sessions ago. Although the latest candle is red, it still stands above the upper Bollinger Band, underscoring bullish strength.
Similarly, the SROC indicator continues its upward path above the equilibrium line. Technically, all signs align to suggest that the market is poised to move toward higher price levels.
Dogecoin (DOGE) Price Prediction: DOGE/USDT Maintains Higher Baseline (4-Hour Chart)
The ongoing session in the Dogecoin 4-hour chart has shown bearish tendencies, based on the last two candles. However, price action has mostly been consolidating near the upper Bollinger Band, rather than declining significantly.
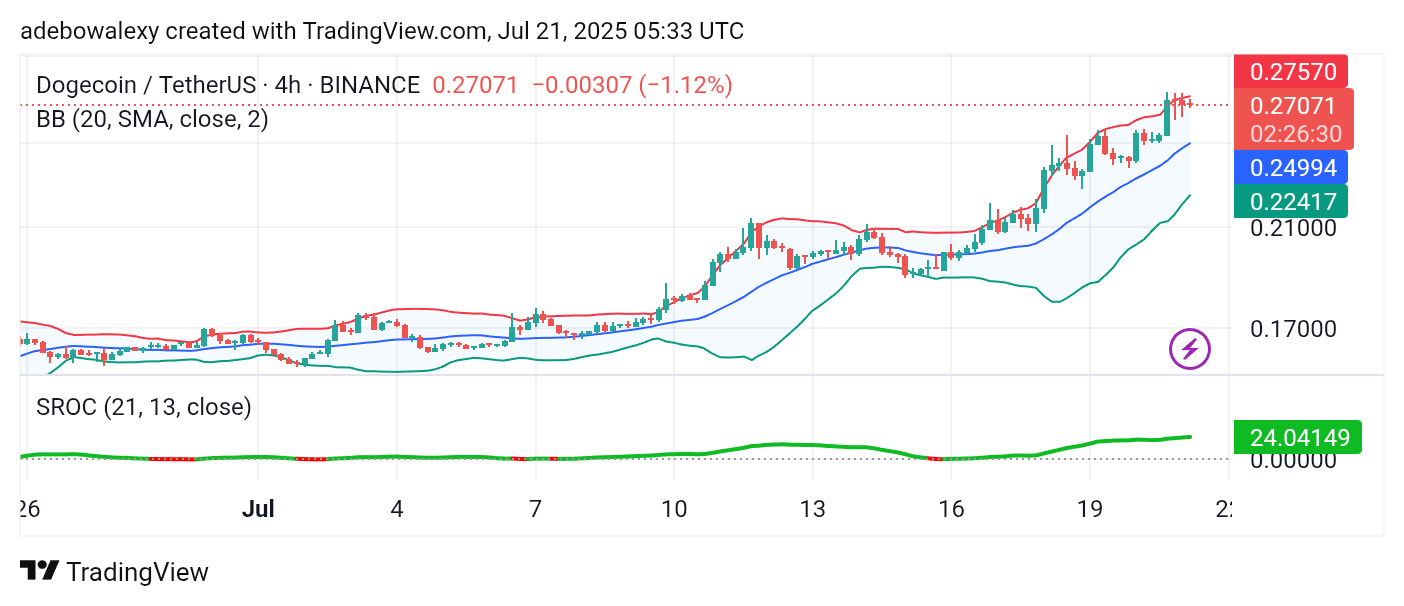
The BB indicator remains projected upward, hinting at an overall bullish trend. Likewise, the SROC indicator maintains an upward slope and is already positioned above the equilibrium level.
Consequently, the market appears likely to resume its upward move, potentially retracing toward the $0.3200 price level.