EigenLayer (EIGEN/USDT) Touches Down at $2.805 for a Potential Rebound
Estimated Reading Time: 3 minutes
Don’t invest unless you’re prepared to lose all the money you invest. This is a high-risk investment and you are unlikely to be protected if something goes wrong. Take 2 minutes to learn more

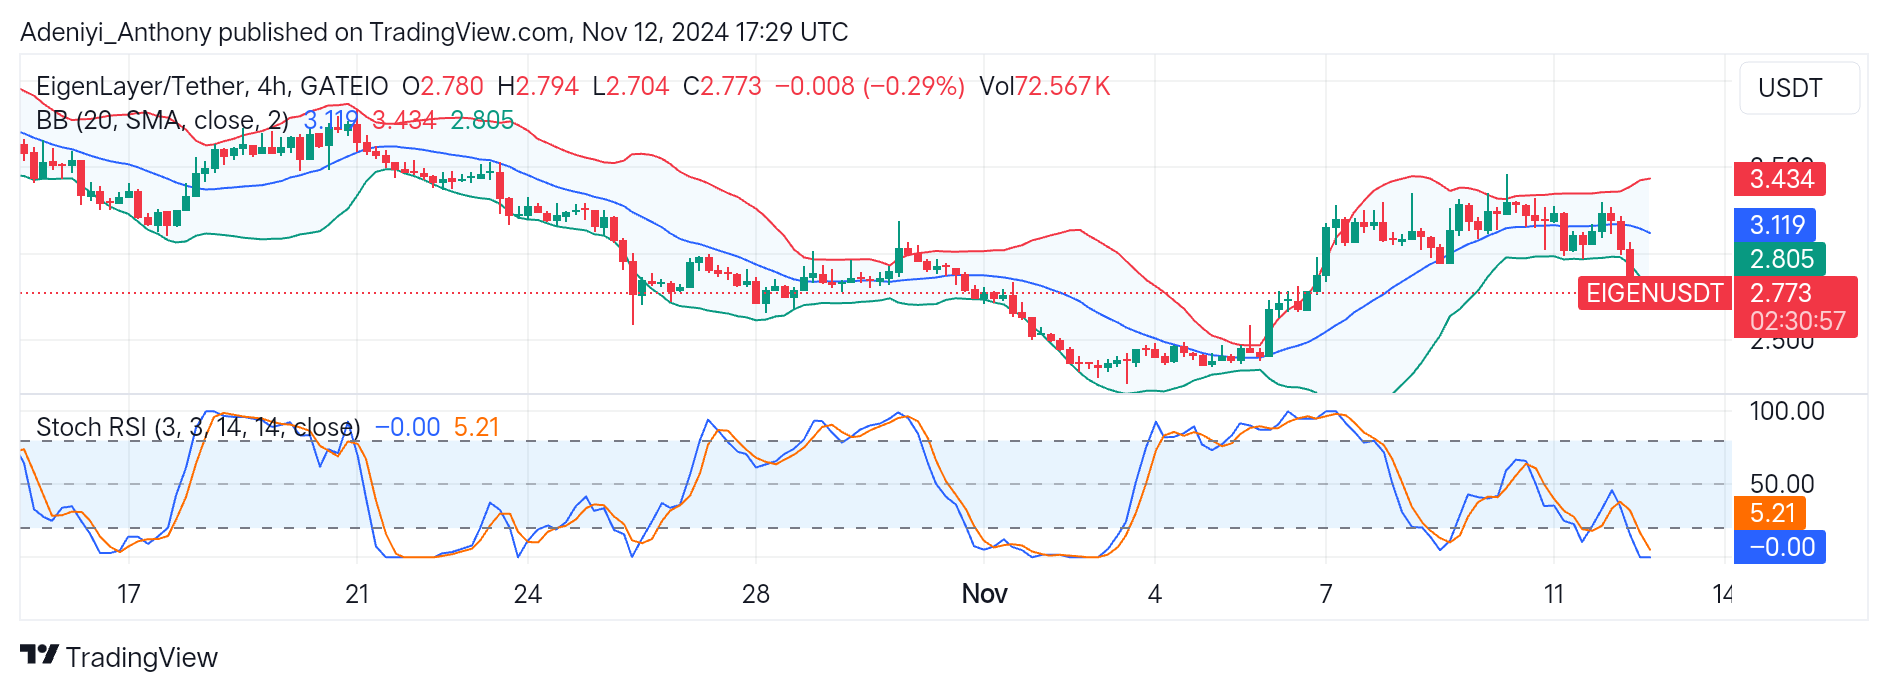
Eigenlayer appears to be in a consolidating phase following a downtrend, with the bands showing constriction, indicating reduced volatility. However, the recent price movement near the lower band at $2.805 suggests a potential downward pressure if the price breaks lower.
Furthermore, the indicators on the chart suggest an oversold condition with the potential for price rebound in the near term.
Currently, Eigenlayer against the USDT trades at $2.773, with 0.29% reflecting the strong selling pressure in the market.
Technical Indicator
Major Resistance Levels: $2.805, $3.119, and $3.434
Major Support Levels: $2.705, $2.500, and $2.250
Eigenlayer Technical Analysis
The analysis of the EigenLayer against the Tether shows that the pair has been oscillating near a key lower level, which indicates an extreme oversold condition suggesting a price rebound is on the horizon. However, if the price breaks below the $2.705 level, it may signal a stronger downtrend. Conversely, a bounce with increased volume at this level may lead to a retest of the middle band at $3.119.
On the other hand, the Stochastic RSI also suggests the pair is deep into the oversold region, with the possibility of a correction to the North. However, the pair may see a continuation of the bearish trend if the lines suspend in the region.
To this end, traders should watch the $2.805 and $2.705 levels carefully, as a break above or below those levels with increased trading volume may change things.
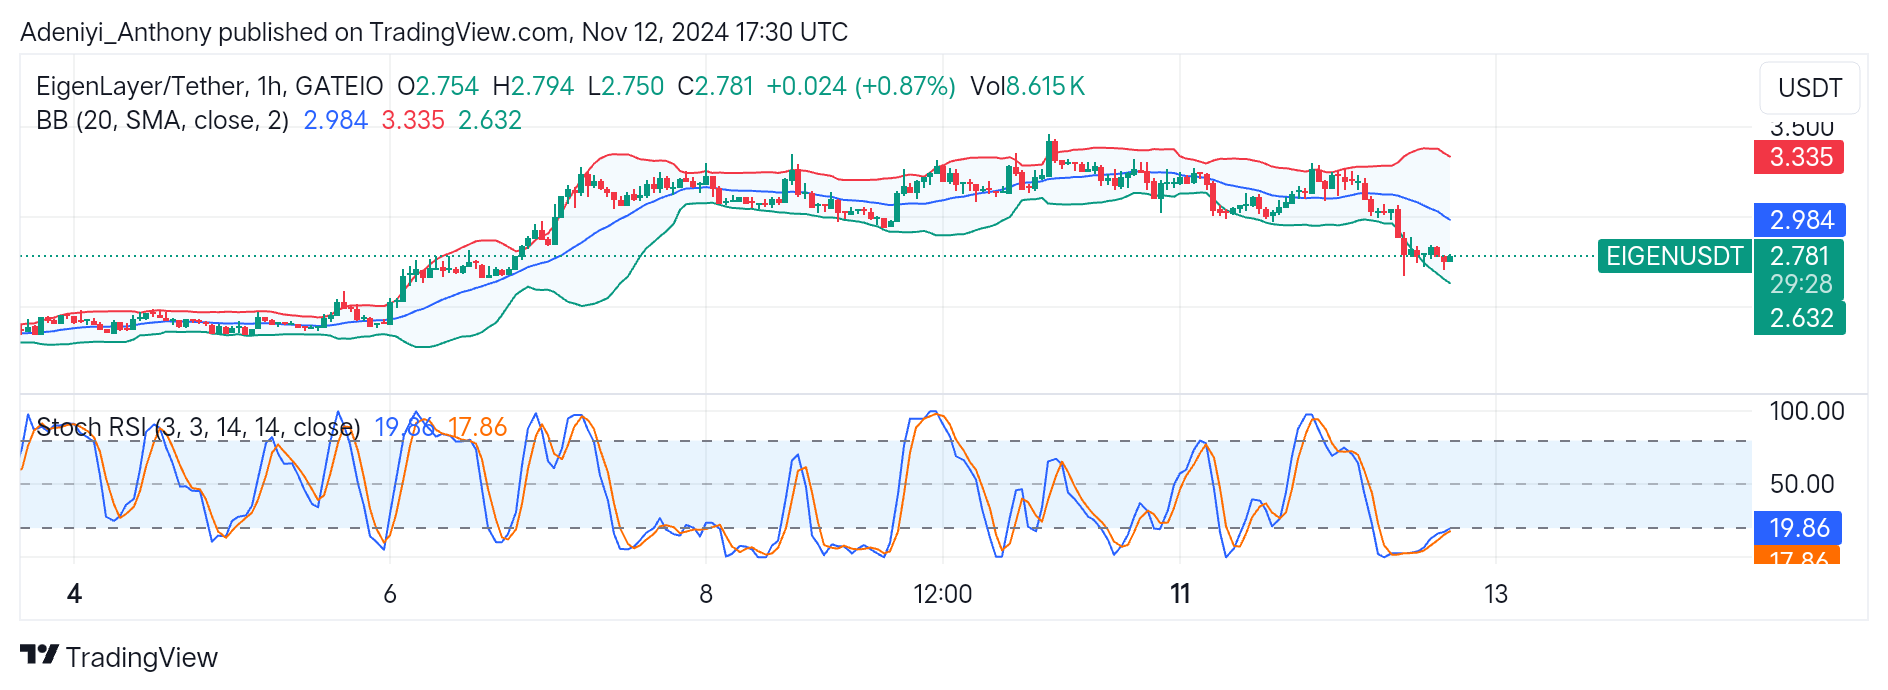
EIGEN/USDT Analysis: A Retracement to the North or a Continued Downtrend?
The analysis of EIGEN/USDT on the 1H timeframe shows a slight downtrend trend with recent price action near the lower band at $2.632. This suggests the price might be experiencing selling pressure. However, the widening of the bands indicates increased volatility. This could mean a continuation of the downtrend if the price fails to hold at the current dynamic support level.
On the downside of the chart, the Stochastic RSI also indicates the pair is currently oversold with the lines of the indicators operating in the oversold region. However, with the positioning and the current direction of the lines, the oscillator suggests the pair hinting at a rebound, which might be difficult to see with a weak trading volume of 8.615k.
To this end, a break above or below the $2.750 level will dictate the direction of the pair in the near term.
You can purchase crypto coins here. Buy LBlock