EigenLayer (EIGEN/USDT) Poised for Downside Correction
Estimated Reading Time: 3 minutes
Don’t invest unless you’re prepared to lose all the money you invest. This is a high-risk investment and you are unlikely to be protected if something goes wrong. Take 2 minutes to learn more

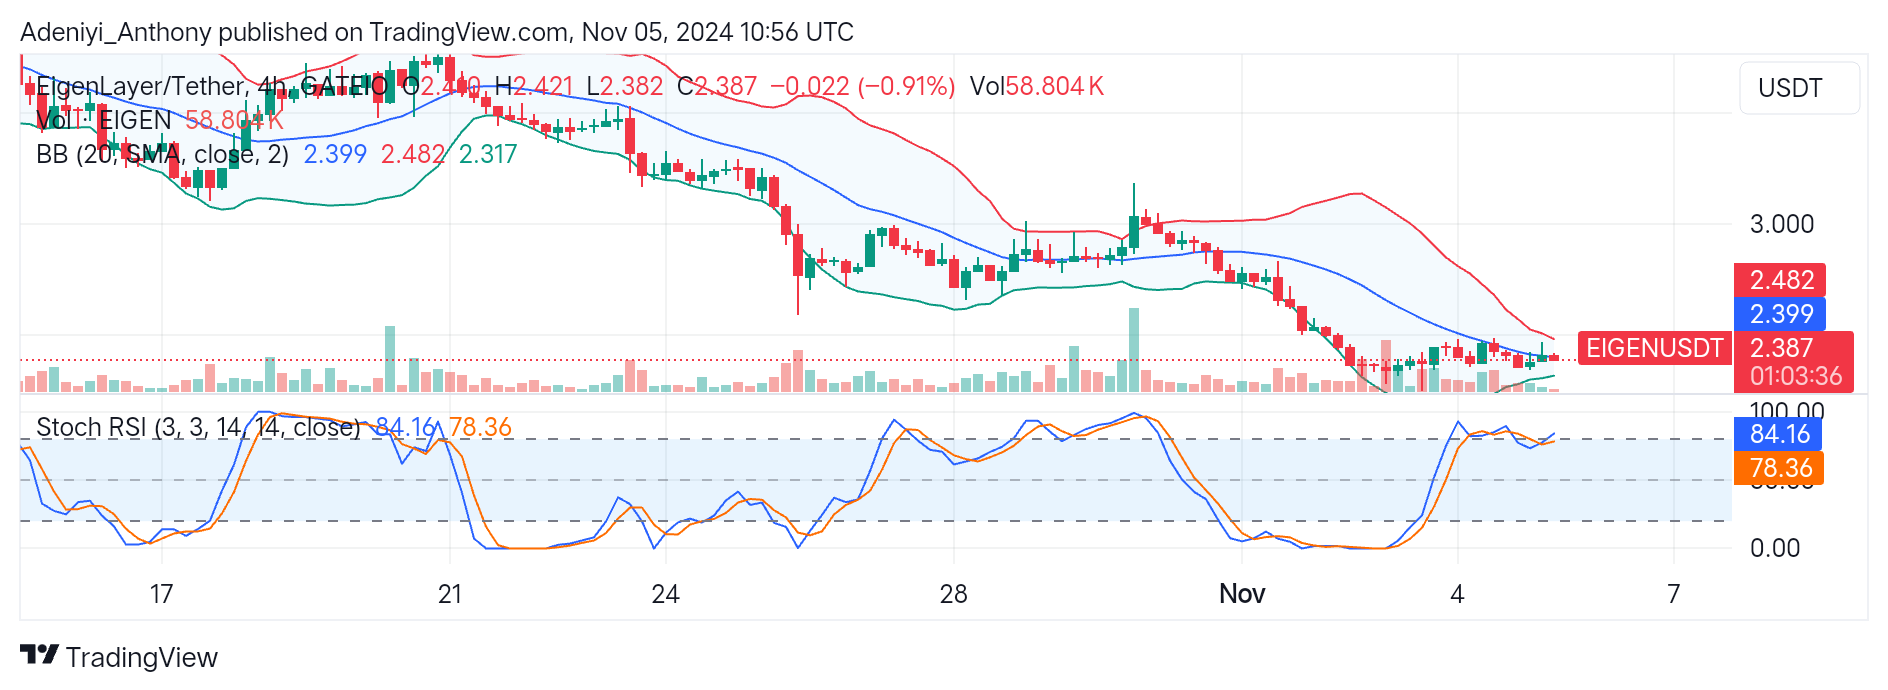
The EigenLayer against the Tether on the 4H chart reflects a bearish trend with a recent period of consolidation. The previous trading session has been characterized by a downtrend, as indicated by the lower highs and lows on the chart. However, there is a potential breakout formation as the price oscillates near the mid-band at $2.399. This may indicate a shift in market sentiment. Therefore, a break over the mid-band in the coming session marks the beginning of an uptrend. Conversely, if the current condition holds, the price may break below the current lower band.
At this juncture, the Bollinger bands have signaled a breakout with their convergence, but the market is still directionless. Traders should watch the behavior of the lines of the Stochastic RSI for indications.
Currently, EigenLayer trades at $2.387, below the dynamic 20-period moving average.
Technical Indicators
Major Resistance Levels: $2.399, $2.482, and $2.550
Major Support Levels: $2.370, $2.317, and $2.20
EigenLayer Technical Analysis
The analysis of the Eigenlayer against the Tether shows that the pair is trading below the mid-band, influenced by the pressure from the recent bearish trend. The convergence of the Bollinger bands speaks volumes about the low volatility condition, which further suggests an impending breakout from either side. If the price fails to maintain the current level at $2.387, it could move further toward the lower band and beyond.
On the other hand, if the bullish momentum picks up and breaks above the $2.399 level, it may further push to the upper Bollinger band. However, the stochastic suggests caution, as the pair operates in the overbought region. A short-term pullback may be seen to accommodate these changes.
EIGEN/USDT Analysis: Breakout to Which Direction?
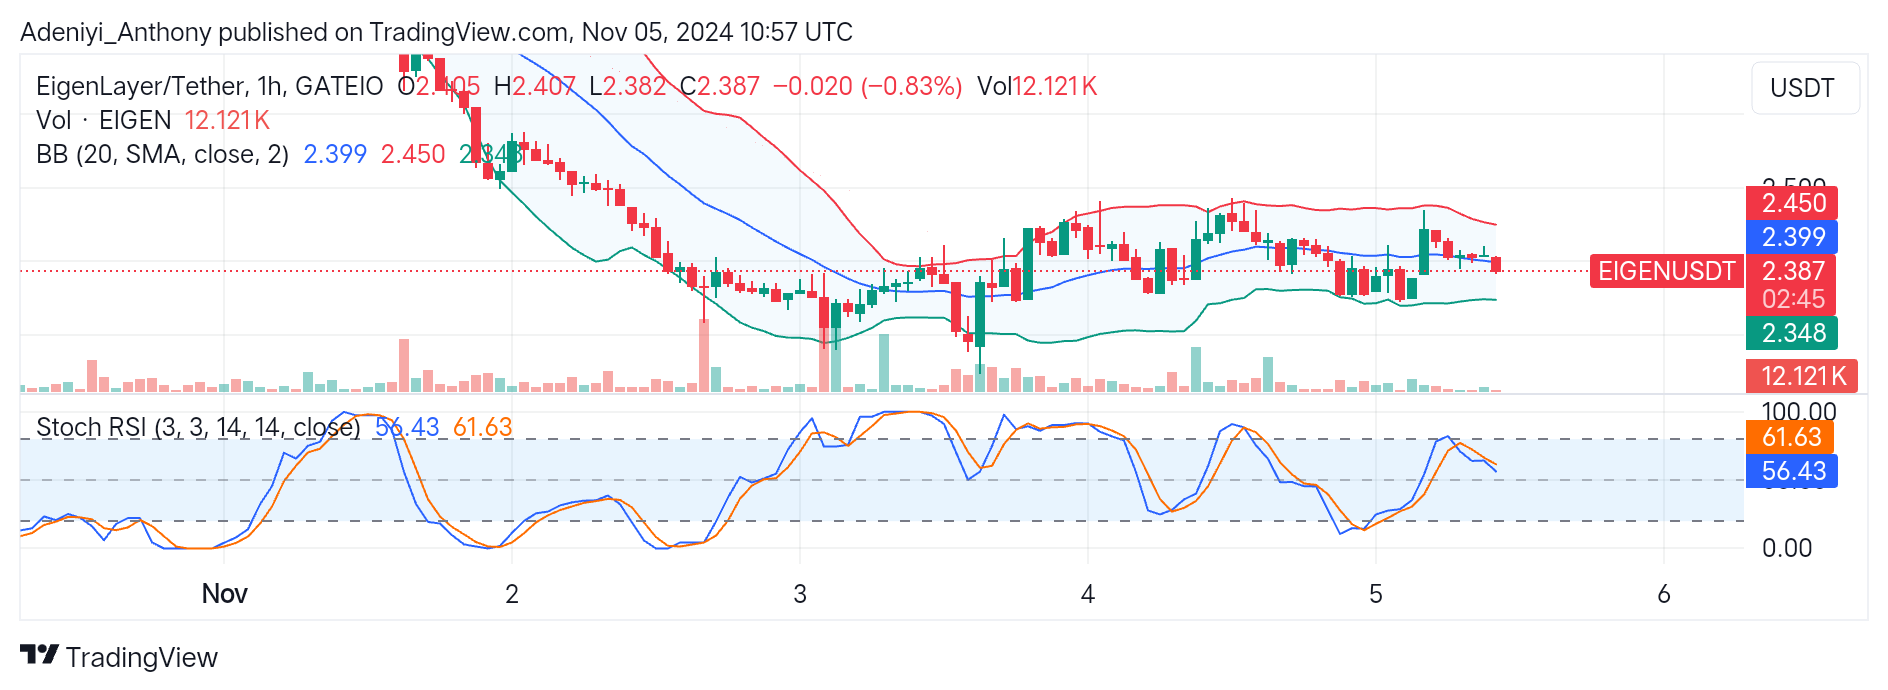
On the 1H chart, the price of Eigenlayer seems to be oscillating within a close-to-perfect range, indicating the indecision that has struck the market as traders await a clearer signal.
The volume in this timeframe seems moderate, which suggests a lack of volatility in the market. Moreover, the Stochastic RSI also operates at the 50-mark level, showing that neither the bears nor the bulls control the market.
This signals a moment when traders must wait for clearer signs before trading. To this end, a break over the upper band at $2.450 may signal the start of a bullish trend. Conversely, a break below the lower band at $2.348 may signal a downtrend.
You can purchase crypto coins here. Buy LBlock