Pepe Is Struggling to Find a Foothold Near Major Lows
Estimated Reading Time: 2 minutes
Don’t invest unless you’re prepared to lose all the money you invest. This is a high-risk investment and you are unlikely to be protected if something goes wrong. Take 2 minutes to learn more

Pepe Price Analysis – PEPE/USD consolidates near fragile base as bearish momentum slows
Pepe continues to wrestle with sustained downward momentum, trading at $0.00000458 (–3.98%) after losing mid‑range support near $0.00000634 earlier in Q4. The coin is attempting to stabilize above $0.00000395, which now serves as a fragile near‑term base.
PEPE Key Levels
Resistance Levels: $0.00000634, $0.00000882
Support Levels: $0.00000395 ,$0.00000320
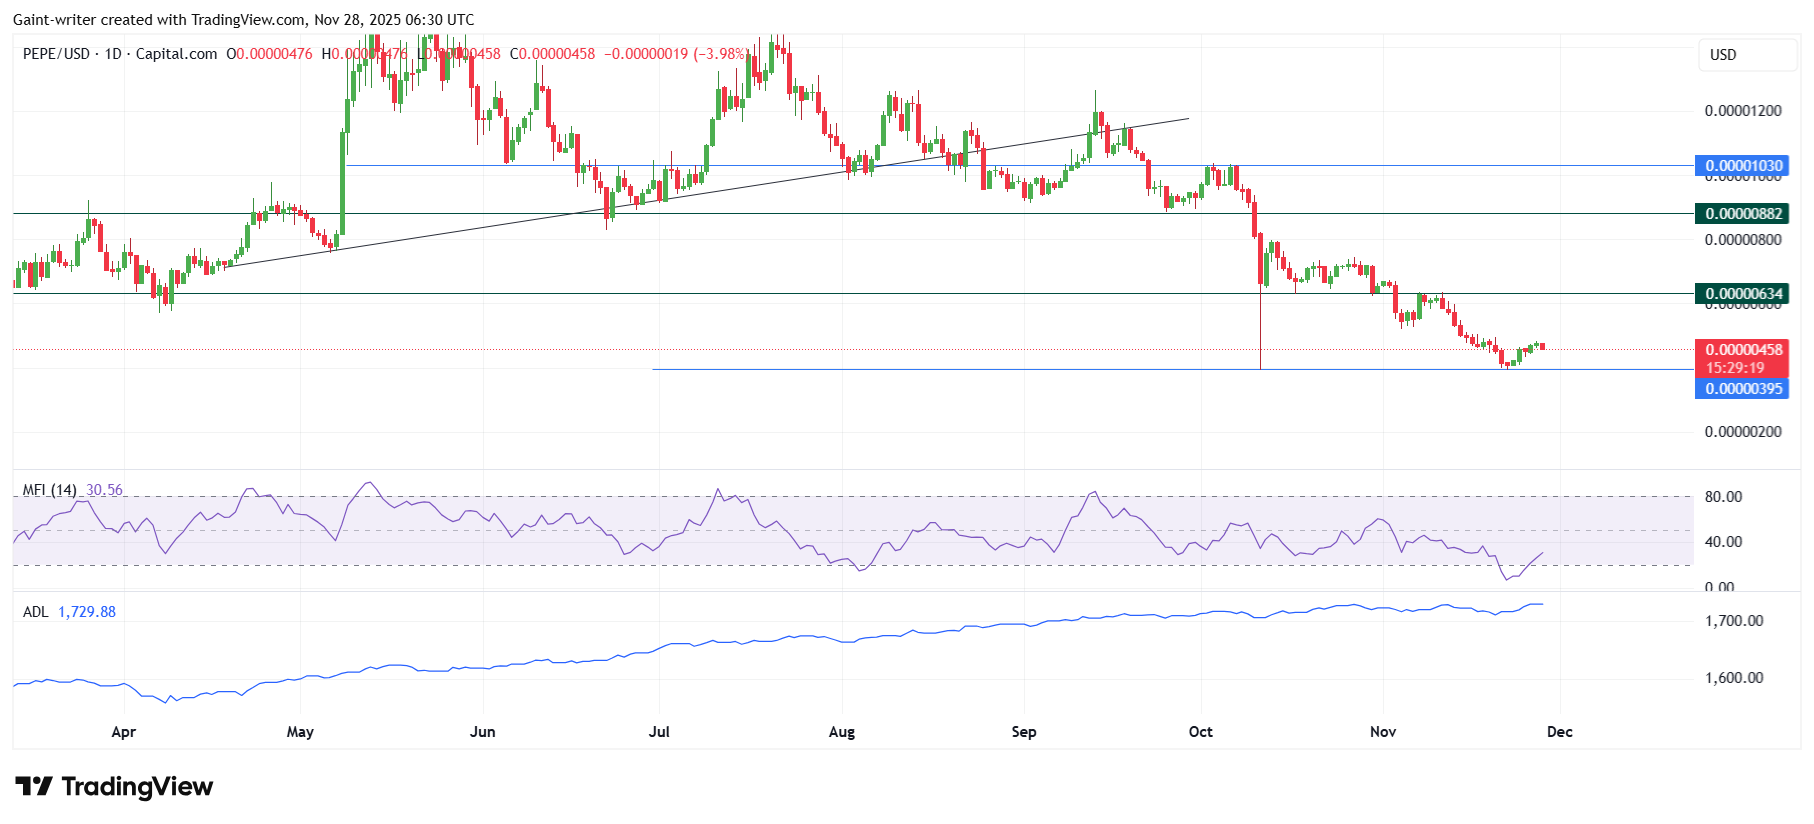
The daily setup reflects short‑term exhaustion within a broader bearish structure. Momentum indicators show slowing decline, but no decisive evidence of renewed buying pressure yet. Unless PEPE can reclaim $0.00000634, the larger trend remains downward, with any bounces likely limited in scope.
Meme‑coins like PEPE remain highly liquidity‑sensitive, reacting quickly to shifts in risk appetite across the crypto market. Reduced trading volume and muted MFI readings show retail traders are hesitant to commit fresh capital. Despite this, the ADL’s mild rise implies some accumulation may be occurring, with long‑term speculators positioning near perceived bottoms.
A strong close above $0.00000634 could spark a short‑squeeze bounce toward $0.00000882, provided MFI recovers above 50 and volume expands. Failure to defend $0.00000395 would invalidate the base, exposing lower targets at $0.00000320 or deeper liquidity zones.
 Market Expectation
 Market Expectation
On shorter timeframes, PEPE trades quietly just above $0.0000045, consolidating after rebounding from $0.00000395 earlier this week. A modest sideways band has formed between $0.0000040–$0.0000050, characterized by low volatility and indecisive sentiment.
Price compression signals a base‑building attempt, though conviction is weak. A breakout above $0.0000050 could trigger continuation toward $0.0000063, while a slip beneath $0.0000040 would likely renew downside pressure.
You can purchase Lucky Block here. Buy LBLOCK
Note: Cryptosignals.org is not a financial advisor. Do your research before investing your funds in any financial asset or presented product or event. We are not responsible for your investing results.