Band Protocol (BAND/USD) to Begin a New Bullish Cycle at the $1.00 Price Level
Estimated Reading Time: 3 minutes
Don’t invest unless you’re prepared to lose all the money you invest. This is a high-risk investment and you are unlikely to be protected if something goes wrong. Take 2 minutes to learn more
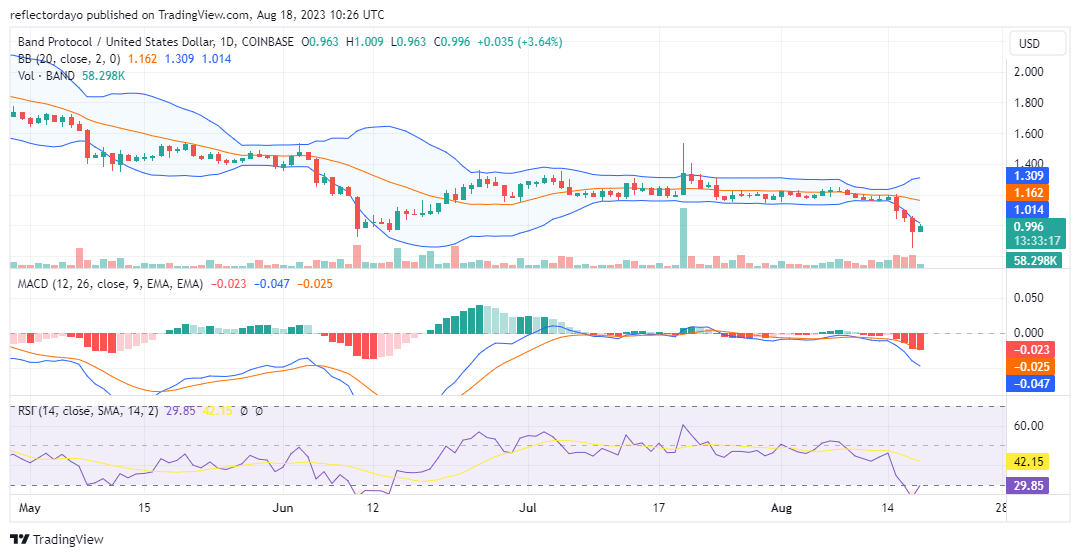
The $1.00 price level has served as the primary support since mid-June, marking the initiation point of the last bullish cycle. However, this bullish run encountered significant bearish resistance around the $1.400 price level. This resistance led to an extensive consolidation phase spanning from late June through all of July up to early August. During this period, the selling pressure intensified, ultimately causing the Band Protocol buyers to succumb.
Consequently, the price retraced to the critical $1.00 support level. While the preceding bear market extended to as low as the $0.852 price level in the previous daily session, a sharp rebound occurred, continuing into today’s trading session. This resurgence raises the possibility of the bulls regaining control and reclaiming the $1.00 price level.
The Band Protocol Market Data
- BAND/USD Price Now: $0.996
- BAND/USD Market Cap: $132,604,507
- BAND/USD Circulating Supply: 133,075,751 BAND
- BAND/USD Total Supply: 137,475,751 BAND
- BAND/USD CoinMarketCap Ranking: #167
Key Levels
- Resistance: $1.40, $1.50, and $1.60.
- Support: $0.80, $0.70, and $0.60.
Price Prediction for Band Protocol: The Indicators’ Point of View
There is a possibility of a rebound from the current market level. This possibility is supported by the three indicators used for this analysis, all of which indicate an oversold market.
The first indicator, the Bollinger Bands, reveals that price actions are currently occurring outside the bands, suggesting signs of being overextended. In the Relative Strength Index (RSI), the RSI line has recently bounced back to the 30 level, on the verge of crossing back into the selling zone. Examining the Moving Average Convergence and Divergence (MACD) indicator, the MACD line has significantly distanced itself from the zero level, accompanied by negative histograms. This underscores the aggressive bearish sentiment in the market.
Despite the dominance of the bears, the Band Protocol market’s overbought conditions could prompt a rebound. The anticipation is that the market will self-correct due to being traded at a value exceeding its intrinsic worth.
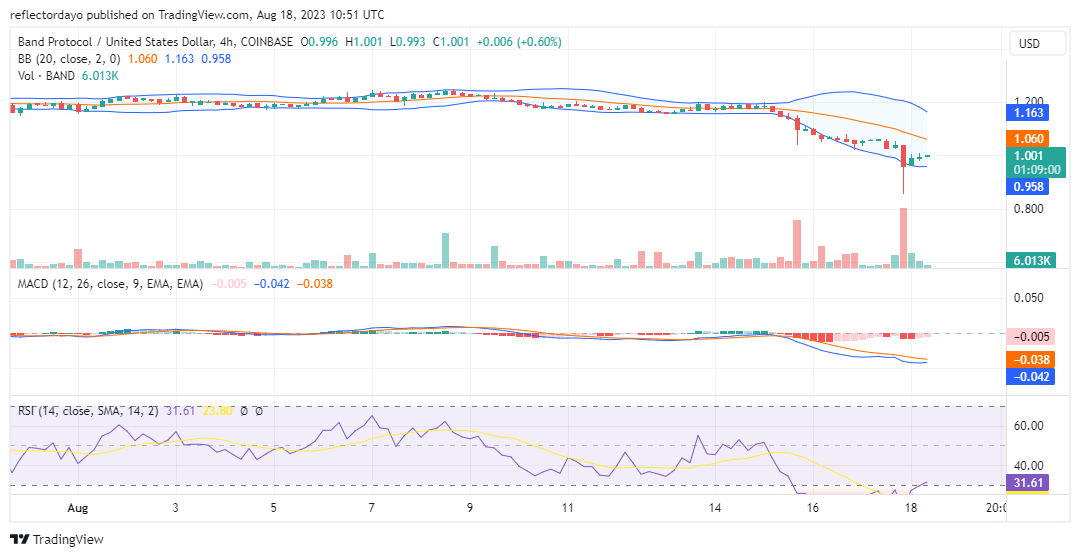
BAND/USD 4-Hour Chart Outlook
During the preceding daily session, the final 4-hour period witnessed a surge in investor interest in selling. However, as the market reached the low of $0.858, traders promptly initiated substantial buying once more. Nevertheless, the bulls are currently faced with the challenge of overcoming the $1.00 resistance price level, which previously acted as a support level.
The recuperation process has been hindered by a decrease in trading volume. Despite this, the market exhibits potential for a bullish rebound.