Lucky Block Price Prediction: LBLOCK/USD Looks for Higher Support; What Next?
Estimated Reading Time: 3 minutes
Don’t invest unless you’re prepared to lose all the money you invest. This is a high-risk investment and you are unlikely to be protected if something goes wrong. Take 2 minutes to learn more
Lucky Block Price Prediction – December 18
The Lucky Block price prediction reveals that LBLOCK is trading around $0.000053 as buyers get ready to push the market to the upside.
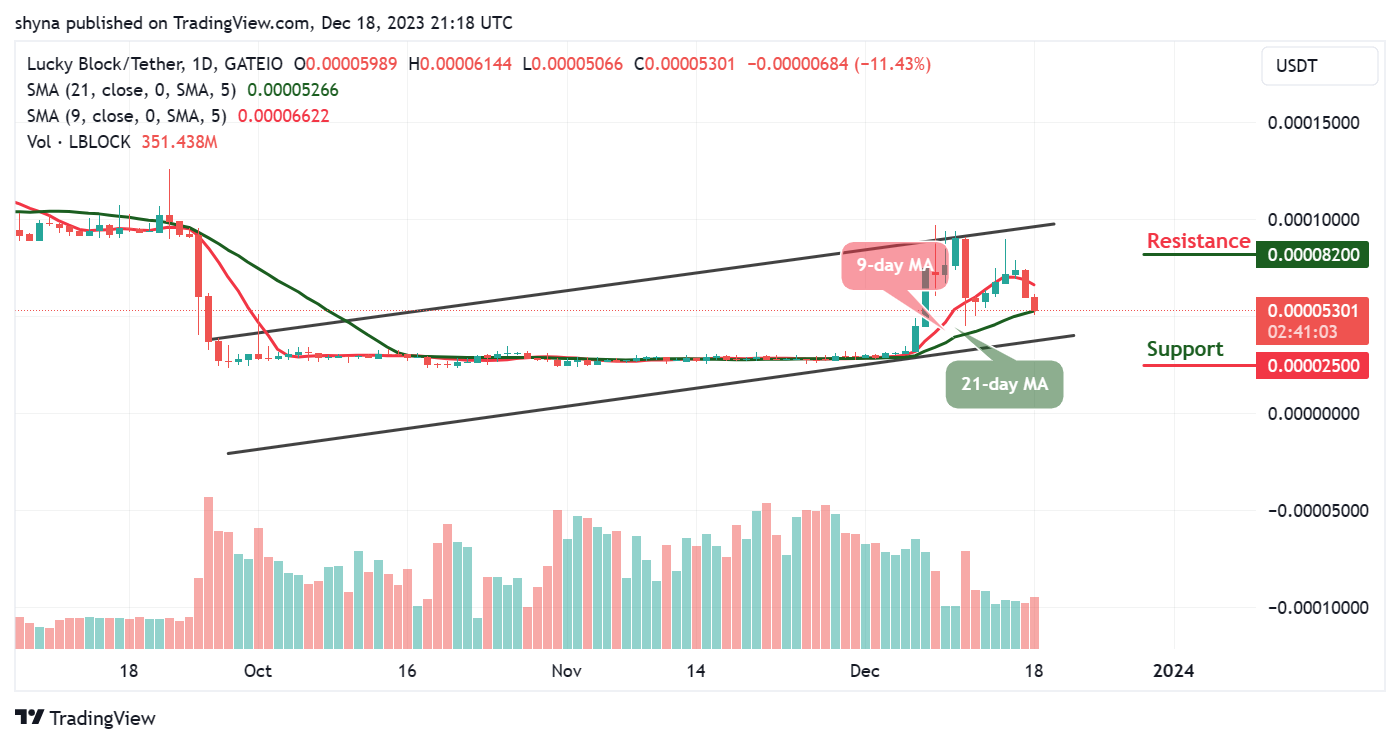
LBLOCK/USD Long-term Trend: Ranging (1D Chart)
Key Levels:
Resistance levels: $0.000082, $0.000084, $0.000085
Support levels: $0.000025, $0.0000023, $0.0000021
LBLOCK/USD buyers have been trying to push the price toward the resistance level of $0.000053 but sellers are also trying to bring it to its lowest support near $0.000050. However, the Lucky Block was able to recover shortly afterward, this crypto appears to have found a strong landing support where it could take an upward movement.
Lucky Block Price Prediction: LBLOCK/USD Will Head to the Upside
The Lucky Block price is poised for an uptick in volume, signaling a bullish regrouping in a positive direction. However, any delay in the coin’s bullish movement may invite intensified bearish pressure, leading to further downturns for new investors entering the market. In the event of such a scenario, key support levels are anticipated at $0.000025, $0.0000023, and $0.0000021, respectively.
Nonetheless, a bullish trajectory is anticipated for the Lucky Block price, supported by the 9-day moving average consistently staying above the 21-day moving average. In this context, potential resistance levels at $0.000082, $0.000084, and $0.000085 are likely to come into play if buyers intensify their buying pressure.
LBLOCK/USD Medium-term Trend: Bearish (4H Chart)
The Lucky Block price is currently situated below the 9-day and 21-day moving averages. As the coin approaches a support level, signs of an upward movement are evident. However, a potential breakthrough above the moving averages could propel the Lucky Block price into an upward trajectory, aiming for a resistance level at $0.000085 and above.
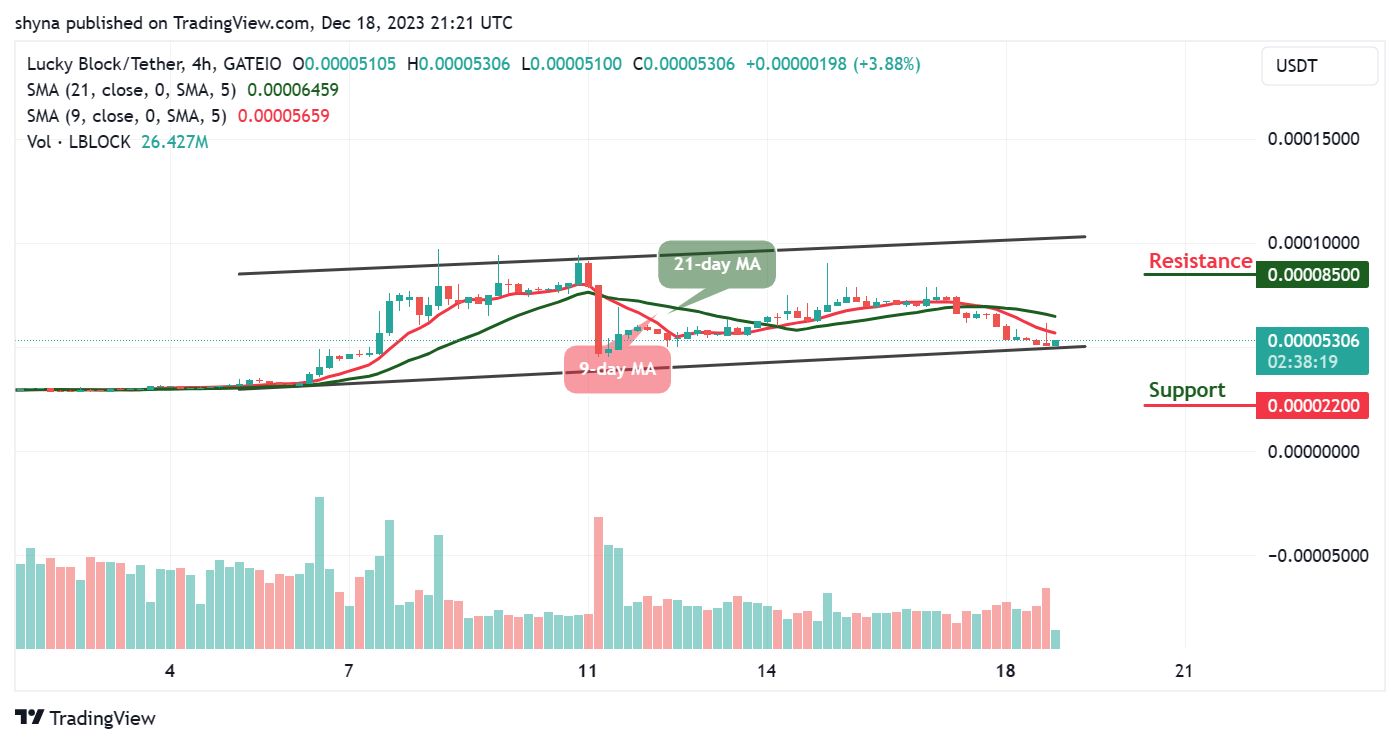
Conversely, there is a risk of the Lucky Block price sliding below the lower boundary of the channel, targeting the support level at $0.000022 and below if selling pressure returns to the market. Meanwhile, it’s worth noting that a rebound may occur as buyers are anticipated to step in to seize opportunities during dips. Additionally, the 9-day moving average is currently positioned below the 21-day moving average, which could suggest a potential bullish crossover shortly.
You can purchase Lucky Block here. Buy LBLOCK