Polkadot (DOT) Regains Bullish Momentum, Breaks the Resistance at $17
Estimated Reading Time: 2 minutes
Don’t invest unless you’re prepared to lose all the money you invest. This is a high-risk investment and you are unlikely to be protected if something goes wrong. Take 2 minutes to learn more
Polkadot (DOT) Long-Term Analysis: Bearish
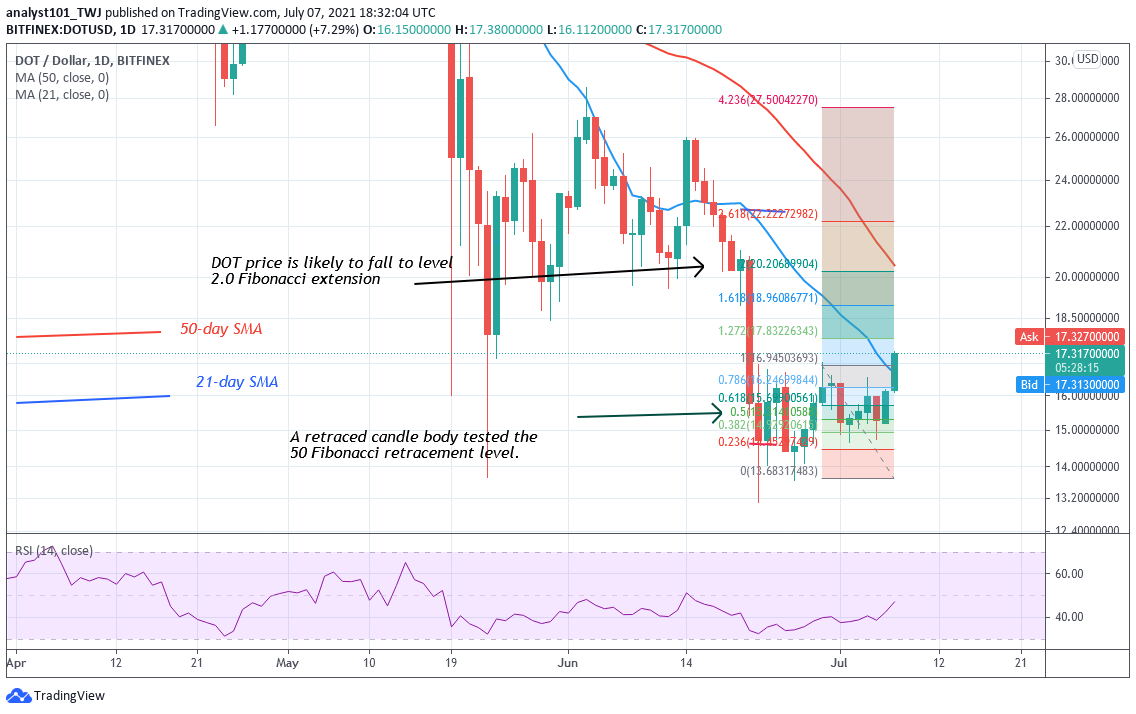
Polkadot (DOT) is making positive moves after breaking above the $17 high. Since June 22, the DOT price has been in a downward correction as the coin fluctuates between $13.50 and $17. The upward move is likely to be short-lived as the crypto reaches the overbought region. Meanwhile, on April 29 uptrend, a retraced candle body tested the 50 Fibonacci retracement level. The retracement indicates that DOT price will rise to level 2.0 Fibonacci extension or level $20.20. From the price action, DOT price has risen to $17.59
Polkadot (DOT) Indicator Analysis
DOT price is at level 48 of the Relative Strength Index period 14. It indicates that the altcoin is in the downtrend zone and below the centerline 50. The crypto is above the 80% range of the daily stochastic. It indicates that the market is in the overbought region. The uptrend is likely to subside. The 21-day and 50-day SMAs are sloping southward.

Technical indicators:
Major Resistance Levels – $48, $52, $56
Major Support Levels – $32, $28, $24
What Is the Next Direction for Polkadot (DOT)?
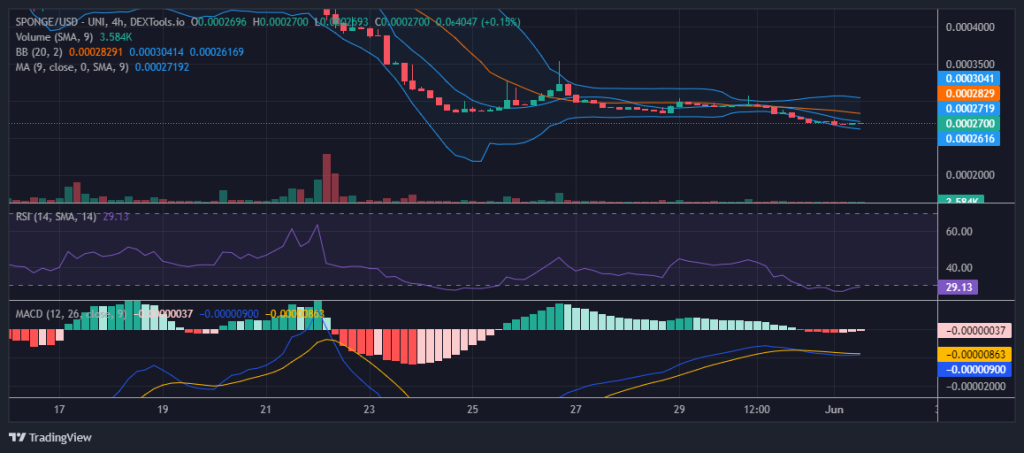
On the 4 –hour chart, Polkadot has an upward move after breaking the $17 resistance. The bulls were repelled twice before the eventual breakout above $17. Meanwhile, on June 29 uptrend; a retraced candle body tested the 61.8% Fibonacci retracement level. This retracement indicates that DOT price will rise to level 1.618 Fibonacci extension or level $18.74.

You can purchase crypto coins here. Buy Tokens
Note: new.cryptosignals.org is not a financial advisor. Do your research before investing your funds in any financial asset or presented product or event. We are not responsible for your investing result