BNB (BNB/USDT) Targets More Gains as Bullish Momentum Builds
Estimated Reading Time: 3 minutes
Don’t invest unless you’re prepared to lose all the money you invest. This is a high-risk investment and you are unlikely to be protected if something goes wrong. Take 2 minutes to learn more
BNBUSDT Long-term Analysis: Bullish
BNB against Tether appears to be predominantly bullish, as seen in the upward movement in its price action. However, over the past few weeks, BNB has shown consistent growth, driven by increasing bullish momentum.
In recent times, BNB has surged above critical levels and is now testing new resistance zones. The price movement indicates that the bulls are in control, though there are some signs of minor overextension.
To this end, if the price holds above support levels and the Stochastic RSI turns upside into a healthier range, we could expect further upward movement towards higher resistance. Currently, BNB trades at $758.90, recording more than 51.8K at the moment.
Technical Analysis Indicators
Major Resistance Levels: $762.11, $800.00, and $850.00
Major Support Levels: $750.84, $710.17, and $665.84
BNB Technical Analysis
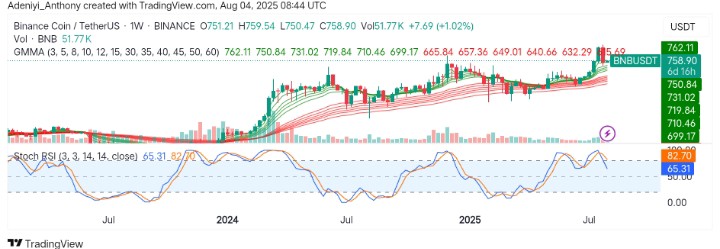
Looking at the weekly chart, BNB against the Tether shows there’s a possibility of forming a bullish continuation pattern, especially with the break above the previous resistance at $750.84. However, the Stochastic RSI is currently at 65.31, indicating that while there is some room for further price appreciation, caution is advised as lines are pointing downward currently.
On the other hand, the Guppy Multiple Moving Averages (GMMA) indicator shows that the short-term moving averages are still above the long-term ones, indicating sustained bullish momentum. To this end, a move above $762 in the current session would confirm a continued uptrend; otherwise, a break below $750 would translate to the opposite.
BNB/USDT Analysis: Consolidating Gains for Future Surge
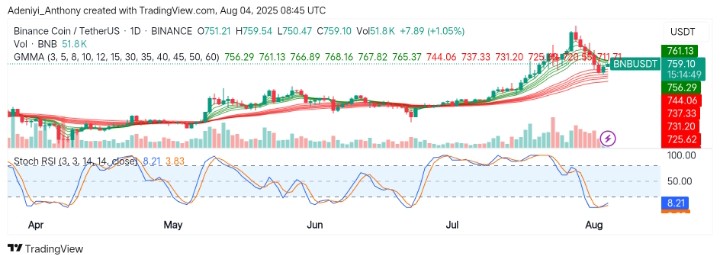
BNB/USDT on the daily timeframe shows a strong uptrend with occasional formation of higher highs, confirming bullish momentum. However, despite recent fluctuations, the pair appears to be holding steady at $750. As it stands, the Stochastic RSI seems to be coming up from oversold territory, indicating a potential bullish momentum continues. On the other hand, the GMMA indicator suggests that short-term buyers remain in control, with short-term moving averages still positioned above longer ones.
To this end, a possible support zone near $750 provides a good base for current upside movement. However, a break above $761 with increased volume will be crucial to confirming continued bullish strength.
You can purchase crypto coins here. Buy LBlock