BNB (BNB/USDT) Builds on Momentum with Projections Towards $800
Estimated Reading Time: 3 minutes
Don’t invest unless you’re prepared to lose all the money you invest. This is a high-risk investment and you are unlikely to be protected if something goes wrong. Take 2 minutes to learn more
BNB/USDT Medium-term Analysis: Bullish
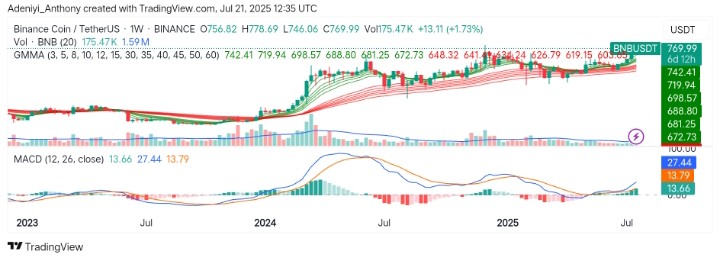
The market for BNB against Tether is shifting upward with projections pointing upward as buying activity increases with time. For several months, the pair has been consolidating between tight ranges, showing signs of indecision. Recent candles printed on a weekly basis are bullish with higher lows, suggesting a growing buyer interest as the pair’s price climbs steadily above the GMMA short-term bands.
From another angle, the MACD is also curving upward, signaling the possibility of a trend continuation towards $800 as BNB trades at $769.99 with over 175 thousand bullish volume.
Technical Indicators
Major Resistance Levels: $778, $800, and $850
Major Support Levels: $742, $719, and $688
BNB Technical Analysis
The analysis of BNB against the Tether shows that the weekly trend of the pair is bullish as price keeps pressing northward even above the Guppy Multiple Moving Averages (GMMA), showing more bullish intent and a break above $800.
Additionally, the MACD appears to be pointing out more bullish actions as bullish histograms increase alongside improved volume. To this end, though volume is not explosive at the moment, a pullback at this juncture might cause the price to return to the $742 range or lower short-term support. However, sustained momentum at the current level would signal a move above $800 if the $778 level is cleared.
BNB/USDT Analysis: Momentum Builds Steadily
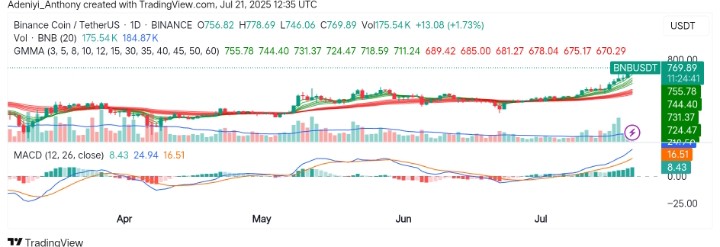
On the daily timeframe, BNB/USDT confirms bullish momentum is growing with price trending above all GMMA clusters, showing sustained demand. However, recent candles are wide-bodied with strong bullish volume, reflecting conviction in the move and the possibility of a pullback.
Beneath the chart, the MACD lines are diverging upward, with histogram bars increasing, showing a clear signal of trend strength. However, a pullback toward $744 may serve as a buy zone. For now, momentum remains in buyers’ control as no reversal signals are in sight.
You can purchase crypto coins here. Buy LBlock
