BNB (BNB/USDT) Bullish Momentum Builds After Long-term Price Squeeze
Estimated Reading Time: 3 minutes
Don’t invest unless you’re prepared to lose all the money you invest. This is a high-risk investment and you are unlikely to be protected if something goes wrong. Take 2 minutes to learn more
BNB/USDT Long-term Analysis: Bullish
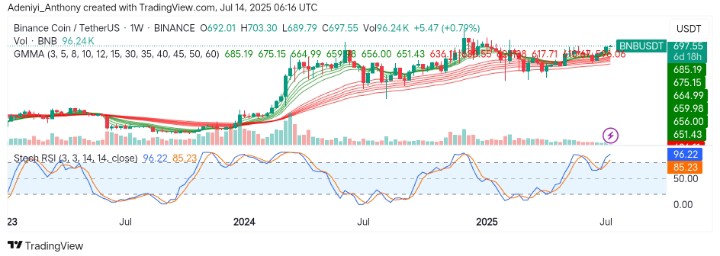
The market sentiment around BNB against the Tether is showing a strong bullish undertone after several months of sideways movement. As it stands, the price has recently shown signs of strength, bouncing above a key resistance zone around $685.
However, the Guppy Multiple Moving Averages (GMMA) show the short-term EMAs now separating upward from the longer-term EMAs, displaying an early sign of breakout continuation.
Recently, the candle formation near the current high suggests buyers are back in control as the Stochastic RSI appears overbought, confirming upward momentum.
Currently, BNB trades at $697.55, recording over 96K traded volumes at the beginning of the week.
Technical Indicators
Major Resistance Levels: $703, $720, and $750
Major Support Levels: $685, $660, and $617
BNB Technical Analysis
The analysis of BNB against the Tether has been consolidating for months in a tight range. However, it appears the pair is breaking out of that structure with a bullish weekly candle. Also, the green short-term EMAs are crossing up and separating, which shows increased buyer strength.
On the other hand, the mild uptick in volume signals a growing participation by the buyers as the Stochastic RSI reads 96.22, indicating a strong bullish momentum, though nearing overbought.
To this end, a healthy pullback towards $685 may be seen before continued movement above $703 in the near term.
BNB/USDT Analysis: Momentum Builds on Breakout
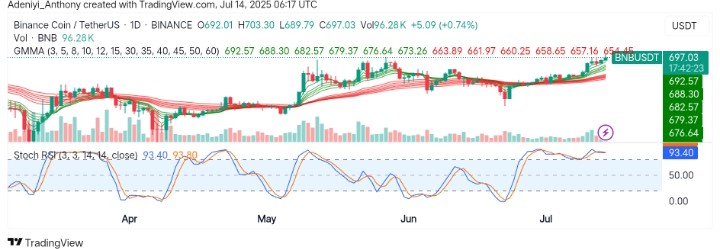
On the daily timeframe, BNB/USDT price action confirms breakout continuation from the weekly chart. The GMMA shows strong short-term bullish separation from long-term trend lines with the pair’s value close above the cluster of moving averages.
From another angle, the volume is gradually increasing, indicating growing buyer interest, with the Stochastic RSI hanging at 93.40, showing persistent momentum.
However, despite bullish participation, the overbought condition of the Stochastic oscillator presents a possibility of a pullback, but a move above $705 would ignite another round of bullish rally towards $720.
You can purchase crypto coins here. Buy LBlock