Ethereum (ETH/USDT) Breaks Out of Compression with Increasing Bullish Momentum Building Up
Estimated Reading Time: 3 minutes
Don’t invest unless you’re prepared to lose all the money you invest. This is a high-risk investment and you are unlikely to be protected if something goes wrong. Take 2 minutes to learn more
ETHUSDT Long-term Analysis: Bullish
The market for Ethereum against the Tether has recently shown a strong recovery after weeks of downward pressure. The price has climbed above several key moving averages, signaling a shift in momentum from bearish to bullish. However, the market is still improving, with increased buying volume confirming growing interest from buyers.
As it stands, the recent breakout above the cluster of Guppy Multiple Moving Averages (GMMA) is a sign that bulls control the sphere. To this end, Ethereum may attempt higher levels in the coming weeks.
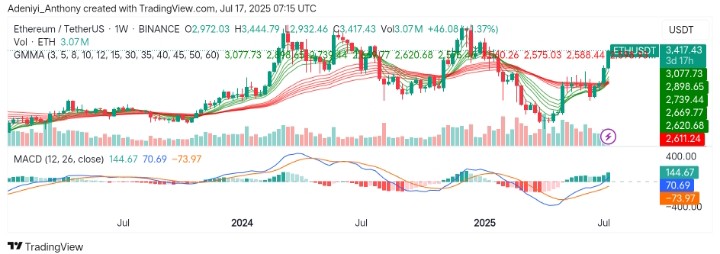
Currently, Ethereum trades at $3,417.43 with over 3 million traded volumes for the week.
Technical Indicators
Major Resistance Levels: $3,444, $3,770, and $4,090
Major Support Levels: $3,077, $2,739, and $2,611
Ethereum Technical Analysis
From the weekly perspective, the price of Ethereum against Tether has faced a prolonged downtrend but recently made a strong bullish breakout above resistance and GMMA bands. However, the structure of developing candles has grown larger with bullish bodies, showing strength and a GMMA bullish crossover.
Also, the MACD appears to have crossed above the signal line with wide divergence, with growing histogram bars. This confirms bullish momentum as visible spikes in buying volume are spotted.
To this end, the pair aims for the $4,000 psychology level, but the $3,444 resistance level must be cleared before further upside.
ETHUSDT Analysis: What to Expect
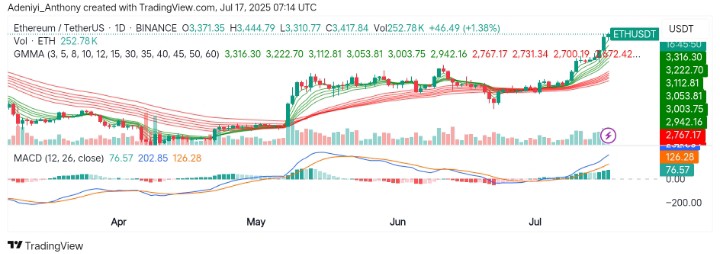
On the daily chart, ETH/USDT is painting a very clear picture as buyers are firmly taking control after a long sideways move. The price finally broke above the resistance zone at around $3,000 and has since been climbing with strong bullish strength.
Also, the MACD has crossed above the signal line with growing histogram bars and increasing volume, showing real buying strength.
To this end, a close above $3,371, even after a pullback from the current level, would signal a more impending upside move. However, moving beyond $3,200 will present a low-risk buying opportunity for the bullish traders.
You can purchase crypto coins here. Buy LBlock