Ethereum (ETH/USDT) Breakout from Consolidation Heads Towards Key Resistance
Estimated Reading Time: 3 minutes
Don’t invest unless you’re prepared to lose all the money you invest. This is a high-risk investment and you are unlikely to be protected if something goes wrong. Take 2 minutes to learn more
ETHUSDT Long-term Analysis: Bullish
Ethereum against the Tether is showing signs of renewed strength after a prolonged period of decline and sideways movement as the pair pushes above the middle Bollinger Band towards $3,000.
Recently, the price action has shown strong upward momentum, supported by increasing volume. Though this signals the possibility of an upside momentum if the resistance zone ahead is broken. However, caution is needed.
Currently, Ethereum trades at $2,769.68, with over 1.6 million transactions recorded for the week.
Technical Indicators
Major Resistance Levels: $2,974, $3,250, and $3,500
Major Support Levels: $2,191, $1,950, and $1,407
Ethereum Technical Analysis
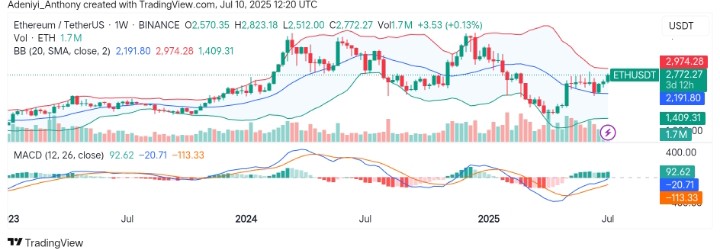
The analysis of Ethereum against Tether reveals that, following a recent consolidation, several bullish weekly candles have formed as the price rides the wave toward the upper band at $2,974.
However, on the other hand, the MACD shows the momentum rising above the signal line as the histogram grows to display positive pressure.
To this end, the pair’s price may close above $2,974 towards $3,250 if the growing bullish volume continues.
However, due to the overbought condition indicated by the price position around the Bollinger Bands, the pair may experience a pullback before upside continuation.
ETHUSDT Analysis: Expectations
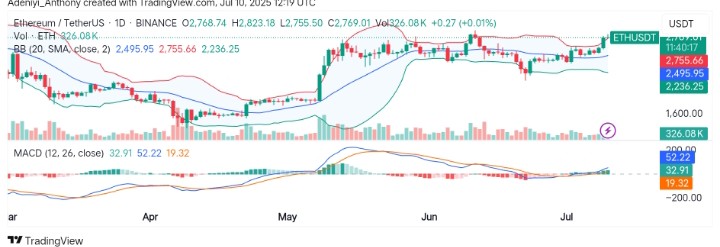
On the daily timeframe, ETH/USDT appears to be trading above the upper limit of the Bollinger Bands with a trajectory towards the north, confirming short-term bullish pressure as participation increases.
Beneath the chart, the MACD has crossed above the signal line, with increasing histogram bars, signaling a fresh bullish wave. However, a bullish breakout candle has formed, closing above the previous daily resistance of around $2,755.
To this end, the trading volume is increasing slightly, backing the upward movement. If the price can break above $2,823 and $2,974, continued momentum to the north may be seen. Conversely, caution is warranted as a slight retracement may be seen.
You can purchase crypto coins here. Buy LBlock