Ethereum (ETH/USDT) Surges Past $2,300 as Bullish Breakout Brews
Estimated Reading Time: 3 minutes
Don’t invest unless you’re prepared to lose all the money you invest. This is a high-risk investment and you are unlikely to be protected if something goes wrong. Take 2 minutes to learn more
Ethereum Long-term Analysis: Bullish
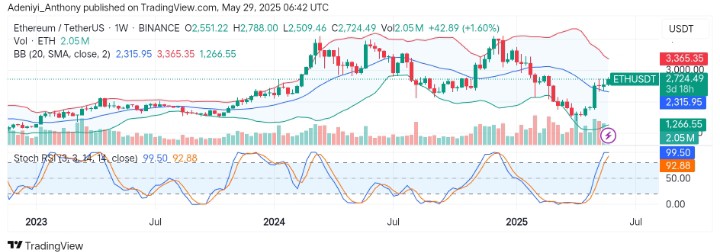
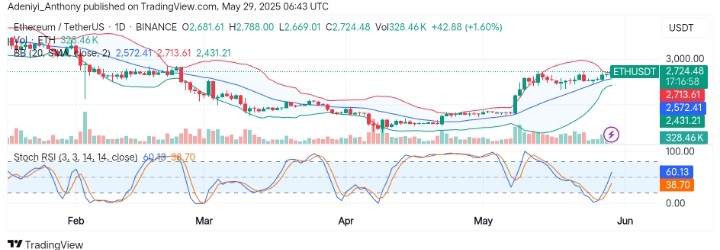
The market for Ethereum against the Tether has shown a renewed strength, pushing above $2,700 after breaking over the $2,300 dynamic level. This happened after weeks of prolonged consolidation and downtrend. However, the market appears bullish as the pair sees a weekly gain of 1.60%.
Recently, the formation of a bullish candle shows the pair appears to have formed a solid base for continuation above $2,700 while aiming at the upper Bollinger Band. However, the signal from the Stochastic RSI shows a cool-off, which may be seen as the oscillator’s lines reading extreme values.
Currently, Ethereum trades at $2,724.49, printing over 2 million traded volumes for the week.
Technical Indicators
Major Resistance Levels: $2,850, $3,000, and $3,365
Major Support Levels: $2,315, $2,000, and $1,266
Ethereum Technical Analysis
On the weekly timeframe, Ethereum against the Tether appears to be gearing up for more upside gains, setting a new high with a strong momentum towards the upper band at $3,365. However, the positioning of the Stochastic oscillator indicates a massive bullish momentum but may be preceded by a short-term consolidation as the blue line extends to the right.
To this end, if momentum can hold and the price and bullish volume are sustained, a move above $3,365 may be seen again. Conversely, a drop in momentum may render the move useless.
ETH/USDT Analysis: Where from Here?
On the daily chart, ETH/USDT seems to be moving on a straight line but in the upper segment of the Bollinger Bands, suggesting bullish support. However, as the bands converge, the pair may see an explosive northbound move in the near term.
From another angle, the oscillator beneath the chart indicates more room for improvement in the short term as the lines project into the overbought region with steadily increasing volumes. As it stands, a move above $2,750 may trigger a more bullish move even above the $3,000 psychological level.
You can purchase crypto coins here. Buy LBlock